Using Slicers to Filter Pivot Grids and Pivot Charts
What are Data Slicers?
Data Slicers are visual filters that allow us to filter pivot grids and pivot charts easily and quickly.
The main advantages of slicers:
- They provide a user-friendly interface to filter the data without the need to open any filter dropdown list.
- They always stay visible with the data, so we always know what values are shown or hidden in the filtered pivot grid or pivot chart.
Introducing the FlexPivotSlicer Control
Although the FlexPivot control already provides a filtering feature which allows us to display a specified set of data as per the filters applied on the fields, it does not provide an easy way to know which values are shown or hidden in the filtered FlexPivotGrid/FlexPivotChart.
To make the filtering easy and more comprehensible, the WinForms 2019 V1 release introduces a new control named FlexPivotSlicer.
The FlexPivotSlicer control not only provides a quick way to filter the FlexPivotGrid/FlexPivotChart data, it also indicates the current filtering state, which makes it easy to understand what exactly is shown in filtered FlexPivotGrid and FlexPivotChart controls. We can also add multiple FlexPivotSlicer controls in an application to filter the pivot data by multiple fields.
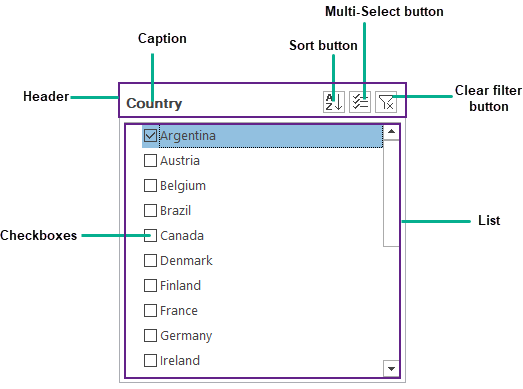
The above image shows how the FlexPivotSlicer control will look like when bound to a field e.g 'Country.' Note that checkboxes and the sort button are not shown by default, however the user can display them with the help of ShowCheckboxes and ShowSort properties of the control.
The FlexPivotSlicer control consists of two primary elements:
- Header: The FlexPivotSlicer control displays a header area at the top of the control. The header area consists of a caption (the name of the field which is being filtered) and the Multi-Select, Clear filter, and Sort buttons (sort button is not shown by default).
- List: Once the FlexPivotSlicer control is bound to the field that needs to be filtered, it shows a list containing all of the unique values from that field. We can then select the field values from that list, to filter the FlexPivotGrid/FlexPivotChart data.
Using the FlexPivotSlicer Control
Consider a scenario where we want to analyze in greater depth a small or specific portion of the overall data that is being displayed by a FlexPivotGrid/FlexPivotChart. Let's say we have a pivot grid/pivot chart displaying the sales of a company and we want to specifically analyze the sales of certain food products in different countries for the last quarter (i.e for the months October, November, and December). This requirement can be accomplished effortlessly using the FlexPivotSlicer control. All we need to do is add and configure the FlexPivotSlicer control and then use it to slice the pivot data by the 'Product Name' and 'Month' criterias as shown in the above image.
Let's start with the implementation.
Here we are assuming that we have already configured a FlexPivot (for more details refer here) to show a summarized view of country-wise product sales of a company in FlexPivotGrid/FlexPivotChart. Now let's understand the properties of the FlexPivotSlicer control that need to be configured to perform the desired filtering.
Data Binding
Once we have added the FlexPivotSlicer control in the application, we need to first bind it to the appropriate field by which the FlexPivotGrid/FlexPivotChart data will be filtered.
To bind the control at design time, use the DataSource and FieldName properties of the FlexPivotSlicer control. Assign an instance of the already configured FlexPivotPanel to the DataSource property and specify the name of the field that we want to filter using the FieldName property.
To bind the control at runtime, specify the field on which we want to perform the filtering using the Field property. This property returns an object of type C1FlexPivotField. The C1FlexPivotField class exposes properties which can be used to customize the field settings such as the formatting for the field values, customizing the text that should be displayed in the UI corresponding to the field name, etc.
The example below demonstrates how the FlexPivotSlicer control can be bound to the 'ProductName' field in code. This slicer can now be used to view the sales of only certain specific products as demonstrated in the above image:
productNameSlicer.Field = c1FlexPivotPanel.FlexPivotEngine.Fields["ProductName"]; //Sets the field which needs to be filtered by the FlexPivotSlicer
productNameSlicer.Field.Caption = "Product Name";
Similarly, we can add more FlexPivotSlicer controls and bind them to the desired fields to filter the FlexPivotGrid/FlexPivotChart data by multiple fields simultaneously.
And that's it! The pivot grid/pivot chart is now ready to be filtered.
In addition to this, the control provides a lot more features to explore. Let's further investigate to configure the control as per our needs.
Customizing the Control
Selection:
By default, the user is allowed to select only one value from the list of field values. However, to allow users to select multiple values in the list, we can make use of the MultiSelect property in code or the Multi-Select button shown in the control's header. To clear the selections, we can use the Clear filter button which is shown at the top right corner of the control.
The example below shows how multiple selection mode can be enabled for the list:
//Allows users to select multiple items from the list
productNameSlicer.MultiSelect = true;
We can further customize the FlexPivotSlicer control to hide or show checkboxes next to each item in the list using the ShowCheckBoxes property of the C1FlexPivotSlicer class.
Sorting:
By default, the list containing the unique field values is sorted in ascending order. However, to sort the list items by a different sort order, SortOrder property of the C1FlexPivotSlicer class can be used. The Sort button is not shown by default in the header area, however we can display it by setting the ShowSort property of the C1FlexPivotSlicer class to true.
The code below shows how the list items can be sorted in descending order and Sort button can be displayed in the control’s header to change the sort order at runtime:
orderMonthSlicer.SortOrder = System.Data.SqlClient.SortOrder.Descending; //Sorts the list in descending order
orderMonthSlicer.ShowSort = true; //Displays the Sort button in the header
Apart from this, we can also control the visibility of the header area, Multi-Select, Clear filter buttons and the Select All/ Unselect All checkbox (shown only when multiple selection is enabled) with the help of ShowHeader, ShowMultiSelect, ShowClear and ShowSelectAll properties of the C1FlexPivotSlicer class.
FlexPivotSlicer Styling
The look and feel of the FlexPivotSlicer control and the visual elements it is comprised of such as the header and the list can be customized by using the SlicerStyles class.
Now filtering the pivot grids and pivot charts is very easy. 😊
How do you plan to use the FlexPivotSlicer control? Please share in the comments below.
Click here to download the sample.. Happy coding!

Palak Bansal