We have added many new features to the v15 release of SpreadJS, but two of the biggest features are the new TableSheet and Data Manager. This blog covers the functionality of these features and how to use them in your JavaScript spreadsheet application.
TableSheet
SpreadJS TableSheet is a new type of sheet component that combines the capabilities of the existing calculation engine with an extremely powerful data table. This quick, data-bound table view includes a relational data manager that makes sorting, filtering, and many other data management functions incredibly fast.
Data Binding
One of the biggest features of TableSheet is the enhanced data binding, which doesn't need to utilize an internal spreadsheet structure. This means that these sheets support features like block-grouping with group-level calculations and slicers. It can efficiently support large amounts of data, more than any other data table component.
There are also panels visible at runtime that allow users to adjust the views for columns and groups of data. In addition, an action column can be used that has a special UI for adding/removing/saving/resetting rows. Records can even be searched by simply providing a value to search for.

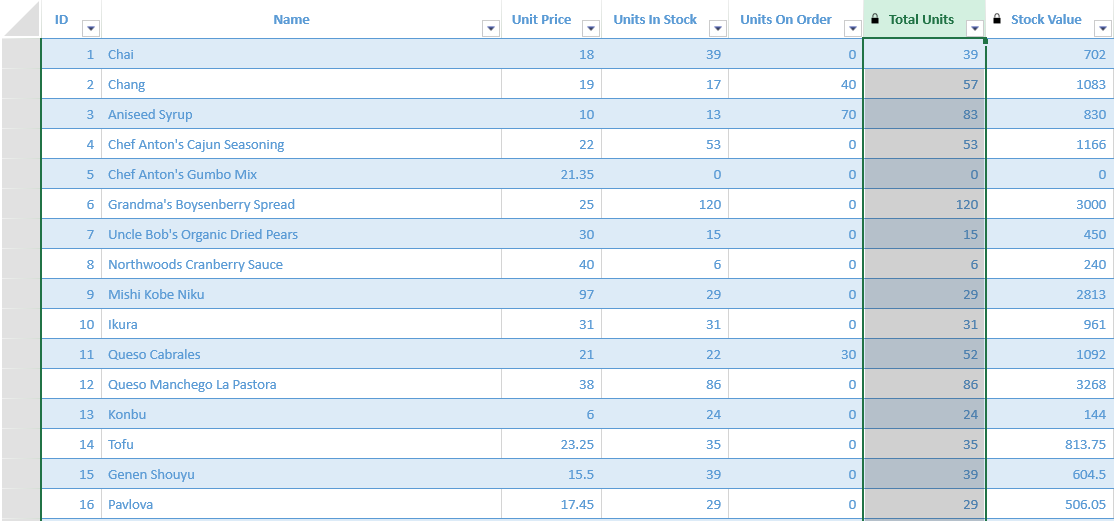
Calculations
With the enhanced calculation engine, take advantage of adding calculated columns to a TableSheet that has simple column references or advanced summary and logical functions, such as:
var myView = productTable.addView("myView", [
    { value: "productId", caption: "ID"},
    { value: "productName", caption: "Name", width: 400 },
    { value: "unitPrice", caption: "Unit Price", width: 100 },
    { value: "unitsInStock", caption: "Units In Stock", width: 100 },
    { value: "unitsOnOrder", caption: "Units On Order", width: 100 },
    { value: "=SUM([@unitsInStock], [@unitsOnOrder])", caption: "Total Amount", width: 100 },
    { value: "=[@unitPrice] * SUM([@unitsInStock], [@unitsOnOrder])", caption: "Total Price", width: 100 }
]);
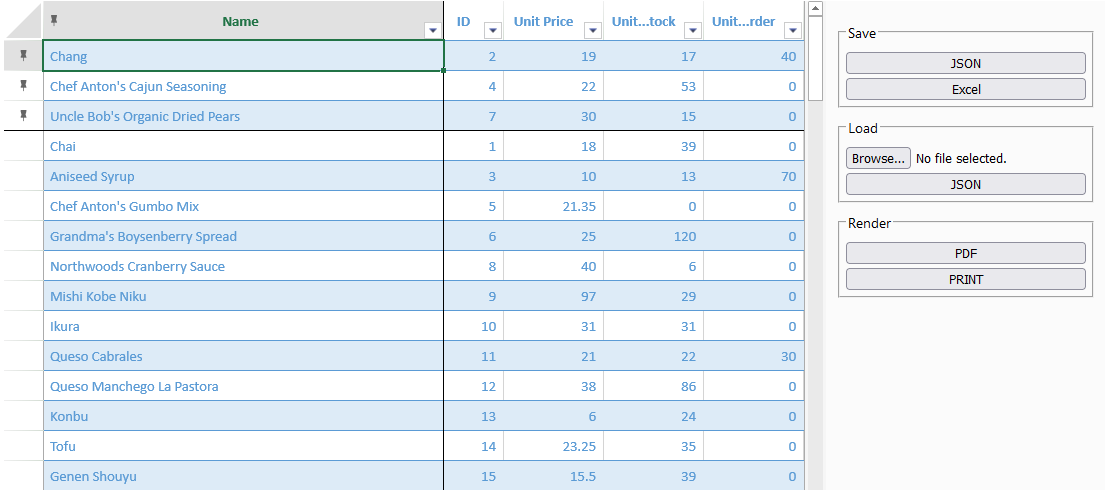
Saving
Like regular SpreadJS worksheets, TableSheet instances can also be exported to JSON, Excel .xlsx, and PDF files.
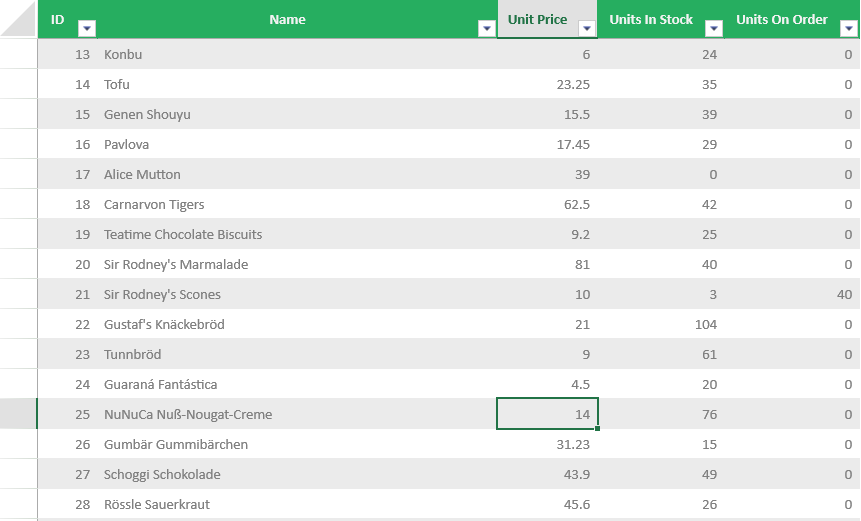
Styles
Similar to SpreadJS, TableSheets support data-bound conditional formatting, data validation, and column styles. Alternating row styles and states can be used to customize further how data looks.
Rows and columns can be pinned to the top and sides of the TableSheet to make sure they are always visible, and this can be done both in code and at runtime. Conditional formatting and its rules are also based on data bound in the TableSheet, rather than the values in cells.

Integration with SpreadJS
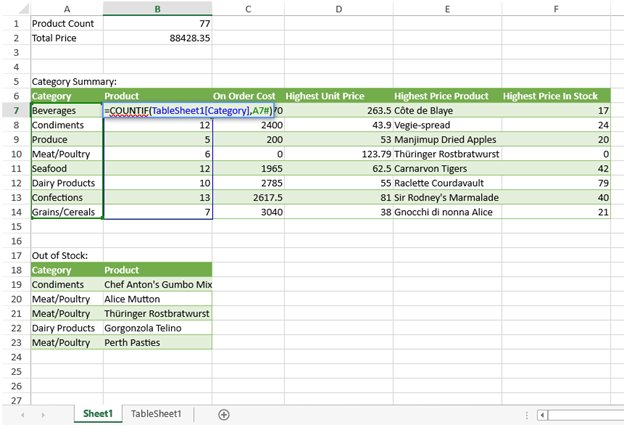
Although different from a standard SpreadJS sheet in a workbook, TableSheets can be added to the workbook, and formulas in a worksheet can cross-reference and summarize data in a TableSheet.
Data Manager
The SpreadJS Data Manager is a powerful new data engine API that makes connecting and interacting with bound data easier than ever before. This component supports data binding, data relationships, and a calculation engine with excellent support for grid calculations at the row, group, and data level.
It supports interaction with the server-side of applications, and will send requests to fetch data.
Bind with TableSheet
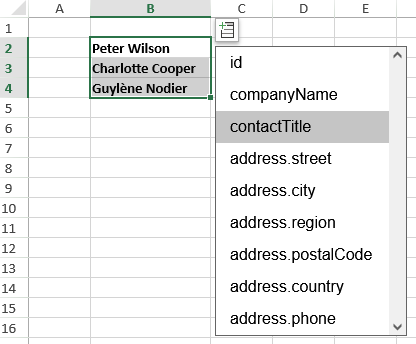
The big draw of the Data Manager is to take data from a data source and create a table for it, which can then be used with TableSheet. Views can also be created to specify which specific data fields will be retrieved and used in the TableSheet.
Using these two components in conjunction provides additional functionality, such as support for custom cell data types which can be projected data-bound cells or formula references. You can also use TableSheet to automatically update the data source in batches using AutoSync or Batch update modes.
Let's Get Started
Now that you understand the basics of TableSheet and Data Manager, try creating a project with them that creates a Data Manager, loads a table within it, and then binds a view of that table to a TableSheet instance.
Download this sample to follow along with the section below!
Initializing Data
The first step is to bind some data using the Data Manager. We just need to add a table to the Data Manager instance using a URL where the data is located:
var tableName = "Order";
var baseApiUrl = getBaseApiUrl();
var apiUrl = baseApiUrl + "/" + tableName;
var dataManager = spread.dataManager();
var myTable = dataManager.addTable("myTable", {
    remote: {
        read: {
            url: apiUrl
        }
    }
});

function getBaseApiUrl() {
    return '/spreadjs/demos/features/table-sheet/overview/purejs'.match(/http.+spreadjs\/demos\//)[0] + 'server/api';
}
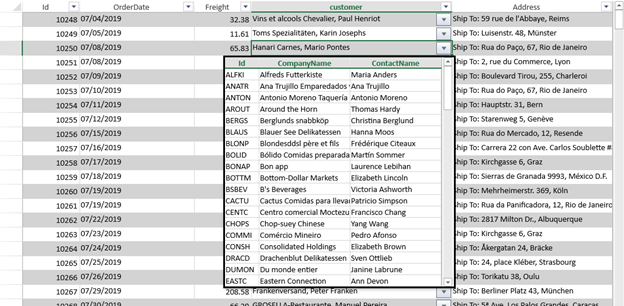
The Data Manager instance contains a table of Orders from the data source, which we can then bind in a TableSheet.
Creating the TableSheet
The next step is to add a TableSheet to the SpreadJS instance, which is as easy as adding a normal sheet but specifying tableSheet as the Sheet Type. In this case, we also want to hide the new row button and action column:
var sheet = spread.addSheetTab(0, "TableSheet1", GC.Spread.Sheets.SheetType.tableSheet); sheet.options.allowAddNew = false; sheet.actionColumn.options({ visible: false });
Setting the View in the TableSheet
The final step to connect the TableSheet to the Data Manager is to create a view from the Data Manager that we can then set in the TableSheet. This view essentially details what fields from the data source should be shown:
myTable.fetch().then(function() {
    var style = { formatter: 'MM/dd/yyyy' };
    var view = myTable.addView("myView", [
        { value: "Id", width: 80 },
        { value: "CustomerId", width: 100 },
        { value: "ShipName", width: 100 },
        { value: "EmployeeId", width: 120 },
        { value: "OrderDate", width: 100, style: style },
        { value: "RequiredDate", width: 120, style: style },
        { value: "ShippedDate", width: 120, style: style },
        { value: "ShipVia", width: 80 },
        { value: "Freight", width: 80 },
        { value: "ShipAddress", width: 120 },
        { value: "ShipCity", width: 100 },
        { value: "ShipRegion", width: 100 },
        { value: "ShipPostalCode", width: 140 },
        { value: "ShipCountry", width: 120 }
    ]); //the View has all default columns of the Table
    sheet.setDataView(view);
});

That's all that's required to set up a simple TableSheet with a Data Manager connected to it. To try out these and many more features, check out SpreadJS v15 today!
Tags:
Related Blogs
Try Our JavaScript Spreadsheet Components
SpreadJS Resources

Kevin Ashley