Using Runtime Designer in FlexChart for WinForms
Charts are visual tools that simplify the presentation of numerical data. FlexChart, ComponentOne's .NET charting control for WinForms, now provides end-user chart customization through a high-performance Runtime Chart Designer. This chart designer has been developed to maximize the usability and customization of charts in your application at the end-user level. With a highly responsive and interactive UI, the Runtime Chart Designer needs a few lines of code to get started. This chart designer can be opened by simply clicking the chart at runtime.
Benefits of FlexChart Runtime Designer
- You can view and customize the chart elements.
- Change the chart type by choosing from a drop-down list of basic chart types.
- Manage the data-bindings by adding or removing data fields to or from the chart axes at runtime.
This designer is useful in many cases. For example, say you need to provide a demographic analysis of different countries of the world over a period of years. This includes showing the evolution of income, life expectancy, and population statistics, preferably in a chart.
It would be convenient to allow the end-user to adjust the chart view according to their own requirements. We can use an integrated Runtime Designer for this purpose.

Let’s utilize the Runtime Designer in FlexChart.
Configuring the Chart and the Runtime Designer
The steps to configure and integrate the Runtime Designer with FlexChart:
- Place the FlexChart control on the form.
-
Set the chart’s DataSource property to plot the required data. Here, we will use Gapminder’s Wealth and Health of Nation's data. This data provides the average life expectancy, GDP per capita and population size for more than 180 countries over a period of 209 years.
chart.DataSource = data; -
Use the chart's Binding properties to set data fields for X-axis and Y-axis.
chart.BindingX = "Income"; chart.Binding = "LifeExpectancy,Population"; -
Add a series to the chart.
var ser = new C1.Win.Chart.Series(); chart.Series.Add(ser); -
Set up a chart type
chart.ChartType = C1.Chart.ChartType.Bubble; -
Invoke the chart designer. The chart designer is provided in a separate assembly, C1.Win.FlexChart.Designer.4.5.2.
var designer = new ChartDesigner(chart);
That's it! Run the code and preview the chart. To view the chart designer, it is needed to simply click in the chart area at the runtime.

Using the Runtime Chart Designer
Now, the end-user can simply change the properties of various chart elements using the Runtime Designer in demographics dashboard.
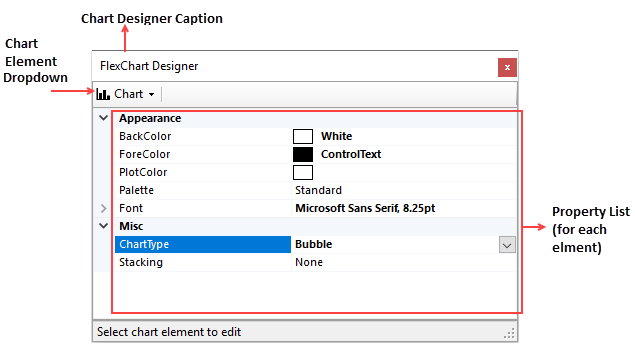
The Runtime Chart Designer provides a drop-down menu to view all the chart elements, like Chart, Data, Header, Footer, Legend, X-Axis, Y-Axis and Data Label. The designer also provides a list of properties corresponding to each element.
The GIF below visualizes the working of the runtime chart designer in the dashboard:
-
Data: This Data element can be used to change the data bindings of the chart along the X-axis and Y-axis. For example, the application displays a Bubble chart representing ‘Life Expectancy’ versus ‘Income per Capita’. However, the user can create a ‘Population’ versus ‘Income per Capita’ chart by setting corresponding data fields on X and Y axes.
-
X-axis: The X-axis element can be used to change the Title, Minimum and Maximum values of the X-axis.
-
Y-axis: The Y-axis element can be used to change the Title, Minimum and Maximum values of the Y-axis.
-
Chart: With this Chart element, the properties such as BackColor, ForeColor, ChartType, etc. can be customized. The Chart Type property provides a list of basic charts, such as Column, Bar, Line, Scatter, Linesymbols, Area, Spline, Spline Symbols, Spline Area, Bubble, Step, Step symbols, Step Area, etc. The user can change the ChartType to any one of these as per the data that needs to be plotted.
-
Header: With the Header element, the Color, Font, and Content of the Header can be customized.
-
Footer: With this element, the Footer Color, Font and Content can be customized.
-
Legend: The Legend element can be used to add a legend to the chart at runtime.
-
Data Label: The Data Label element can be used to change the Content and Positioning of the Data Labels in the chart.
Note that each chart element on the chart area is linked to the corresponding element option in the dropdown menu of Runtime Designer. Each chart element can be clicked to customize its properties in the Runtime Designer.
Customizing the Runtime Chart Designer
Though we are providing an in-built Runtime Designer for FlexChart, it is also possible to customize it for your applications. For this purpose, the source code of the FlexChart Designer ‘ChartDesigner’ is available as a product sample and shipped with the installation of the WinForms Edition.
This should be available at the following location on your machine (if you have chosen the default installation path:
\Documents\ComponentOne Samples\WinForms\v4.5.2\C1FlexChart\CS\ChartDesigner.
Now, customizing the chart appearance at runtime is very easy! Have you tried using the new runtime chart designer? Please share in the comments below. Happy coding!
Download sample | Documentation link
The new FlexChart Designer not only makes customizing chart properties at runtime convenient, but also creates great visualization experience. We hope you like this new feature in FlexChart control. If you have tried using the new Runtime Chart designer, please share in the comments below.
Happy coding!

Sonia Mathew