Visualizing Trends Using Sparklines
Sparklines are mini, lightweight charts that help to visualize data quickly. They were introduced by data visualization legend, Edward Tufte, who describes them as “data-intense, design-simple, word-sized graphics.” Although sparklines do not include many of the elements found in traditional charts (like axes and coordinates), they can be more informative than other chart types based on their simplicity. Due to their compact size, sparklines can be easily embedded in data grids or dashboards to show trends in a series of values, such as sales, weather, or a stock market.
Sparklines in FlexGrid
It's common for sparklines to be used in data grids since they add rich visualization capability to tabular data without taking too much space. With the arrival of ComponentOne 2018 v3, the FlexGrid control provides the feature of showing sparklines in the grid’s column. Let’s understand this feature through a very common use case—analyzing the stock trends of different companies for a particular month.
Use Sparklines to visualize stock market trends
Sparklines provide immediate trending information. This is exactly what the stock market analysts need – instant trending financial data.
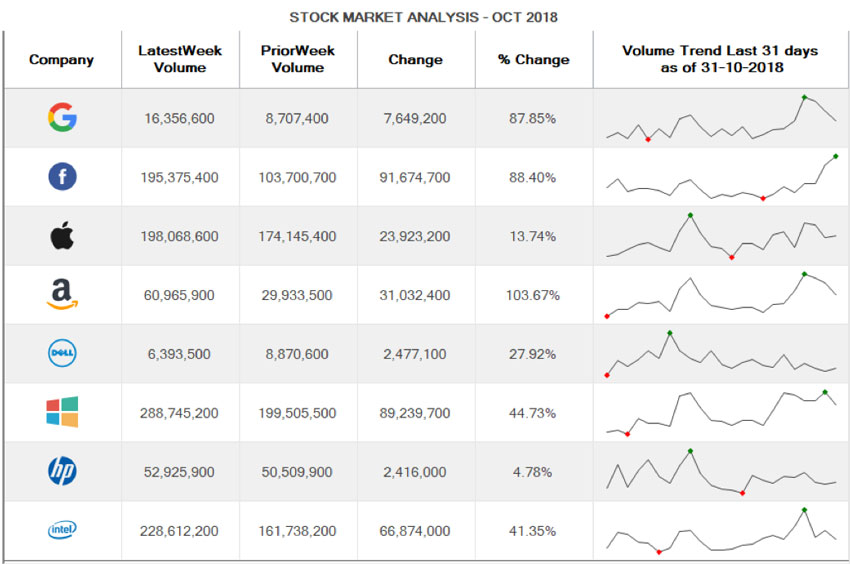
In the example depicted above, the grid shows the following stock information for different companies for the month of October 2018, latest week volume (trading volume for the last 7 days), prior week volume (trading volume for the prior 7 days), week over week change in volume (raw and in percent) along with the trading volume trend for the entire month.
Now, let’s take a look at how this can be implemented in FlexGrid.
Creating the Sparkline Chart
Bind to a data source
Bind the FlexGrid to a data source that contains a field that represents a numeric collection of data. For example, a field that implements the IEnumerable or INotifyCollectionChanged interfaces like Array, List, or ObservableCollection.
We'll bind the grid to a data source containing: the information about the latest week trading volume, prior week trading volume, change and percentage change between the two, and a numeric collection of trading volume for different companies for the month of October.
Once the grid is bound, it’s time to explore the properties we'll need to use, in order to show sparklines in the FlexGrid.
Using ShowSparkline and Sparkline properties
ShowSparkline and Sparkline properties of Column class have been introduced to show sparklines in the corresponding cells for data represented by a collection. So, in order to visualize the trend of the trading volume for a month, just set the column’s ShowSparkline property to true as shown.
Column volumeTrendCol = c1FlexGrid1.Cols["VolumeValues"];
volumeTrendCol.Caption = "Volume Trend Last 31 days\n as of 31-10-2018";
//Set the Column's ShowSparkline property to true to show sparklines in that column
volumeTrendCol.ShowSparkline = true;
You can choose among the three different types of sparklines, namely Column, Line, and WinLoss to visualize data in different contexts.
For example, Line sparklines are suitable to visualize continuous data such as sales figures. Column sparklines are used in scenarios where data comparison is involved, for example, to compare the monthly profits in a particular year.
Similarly, a WinLoss sparkline is best used to visualize a true-false (that is, win-loss) scenario, for example, to track a sports season.
Here, since we have continuous data (trading volumes for a month), so we'll use a line type of sparkline. In order to set the sparkline type, you'll need to retrieve the Sparkline object using the Sparkline property of the Column class.
Then, set the SparklineType property of the retrieved object to SparklineType.Line. You can also use markers to highlight individual data points on a sparkline, in order to make it more readable. For example, to highlight the highest and the lowest trading volume values in the sparklines, set the ShowHigh and ShowLow properties of the Sparkline class to true as shown:
//Sets the type of Sparkline
volumeTrendCol.Sparkline.SparklineType = SparklineType.Line;
//Highlight the highest and the lowest data points
volumeTrendCol.Sparkline.ShowHigh = true;
volumeTrendCol.Sparkline.ShowLow = true;
You can also change the way the sparklines look using the different styling options.
Styling the Sparklines
For styling the sparklines, the FlexGrid control’s namespace [C1.Win.C1FlexGrid] provides a class named SparklineStyles which exposes numerous properties to customize the appearance of the Sparkline, such as the color of the axis, color of the data points,color of the series, distance between two bars of a column/winloss sparkline, and the thickness of the lines in a Line sparkline.
Try it yourself.
Download the sample

Palak Bansal