GrapeCity's SpreadJS v14 release includes several new, exciting features for developing JavaScript applications. These features enhance functionality in the following areas:
- New v14 Designer
- Cell Interactions
- Calculation Enhancements
- Chart Enhancements
New v14 Designer
GrapeCity's SpreadJS Designer is the implementation of an Excel-like user interface with SpreadJS. Features include a ribbon, status bar, formula bar, context menus, and associated dialogs. The base SpreadJS product consists of a free desktop version of the designer, and developers can install it on their machines for improved spreadsheet template design capabilities.
Over the years, customers requested a design interface they could implement in their applications. In response, GrapeCity created a separate add-on product known as the Spread Designer Component. GrapeCity made the SpreadJS Designer more flexible by componentizing it. The SpreadJS v14 Designer includes:
- Add or remove buttons for tabs in the ribbon
- The option to change styling
- The ability to change the functionality of different buttons
- Custom dialogs
This add-on purchase provides the great features and UI of the SpreadJS Designer Component of an application.
For more information about the new designer, contact our sales team at us.sales@grapecity.com or check out our blog here:
Cell Interactions
Some other features focus on user interaction with cells. These features include:
- Incremental Loading
- Accessibility Support
- Multi-Column Picker
- Comment Indicator Customization
- HTML Export
- getRange API Enhancement
- Copy Images from Excel
- NumbersFitMode
- SelectionMode with AutoMerge
- Table Expand Rows API
- Pixel Scrolling with Scrollbar
- Excel Fill Effects and Patterns
Incremental Loading
Incremental loading improves performance when working with large amounts of data. When the feature is enabled, SpreadJS loads values and formulas piece-by-piece in the background, so the user can see the workbook as data is loaded. Use incremental loading when loading a workbook from JSON into SpreadJS:
var jsonOptions = {
        incrementalLoading: true
}
var spread = GC.Spread.Sheets.findControl(document.getElementById('ss1'));
spread.fromJSON(JSON.parse(jsonStr), jsonOptions);
Accessibility Support
GrapeCity is proud to announce that SpreadJS v14 includes compatibility with screen readers and ADA compliance to better assist customers that need accessibility support in their applications. The supported screen readers are NVDA for Windows, Windows Narrator, and VoiceOver for OS X.

Multi-Column Picker
GrapeCity added a new drop-down type to SpreadJS v14: the Multi-Column Picker. Create this drop-down by specifying a data source and column information and then set the style. The property function is especially useful for parsing the returned object.

Comment Indicator Customization
Previously, the comment indicator appeared as a red triangle in the top right of the cell. SpreadJS v14 lets users change the color and size with a few simple API calls:
var comment = new GC.Spread.Sheets.Comments.Comment();
comment.indicatorSize(10); // Default is 6
comment.indicatorColor('blue'); // Default is 'red'
sheet.comments.add(5, 5, comment);

HTML Export
Export cell ranges to HTML tables. Design report tables in SpreadJS and export them to HTML so that they look the same as they do in SpreadJS. Add these report tables to an HTML page and easily customize a report.

getRange API enhancement
Using the getRange API in previous versions, the row index, column index, row count, and column count were needed to get the specified cell range. SpreadJS v14 uses a more convenient parameter: the range address as a string.
Simplify your code like so:
// Get a single cell: sheet.getRange(0, 0, 1, 1)
sheet.getRange("A1")
// Get whole columns: sheet.getRange(-1, 0, -1, 3)
sheet.getRange("A:C")
// Get whole rows: sheet.getRange(0, -1, 3, -1)
sheet.getRange("1:3")
// Get a range: sheet.getRange(0, 0, 3, 3)
sheet.getRange("A1:C3")
Copy Images from Excel
Per-user request, SpreadJS now supports copying images from Excel and pasting them into sheets. The pasted image will have the same size, border, and background as it did in Excel. Charts and shapes are copied as images. Multiple images are converted to a single big image when pasted into SpreadJS.
The allowCopyPasteExcelStyle option of the workbook is enabled by default:
spread.option.allowCopyPasteExcelStyle = true;
NumbersFitMode
Set the display strategy for user-defined date and number types with the NumberFitMode option. This option has two enumeration options: mask and overflow.
- GC.Spread.Sheets.NumbersFitMode.mask: enabled by default, displays "###" in place of numbers or dates that don't fit in the cell
- GC.Spread.Sheets.NumbersFitMode.overflow: overflows dates or numbers into adjacent cells

SelectionMode with AutoMerge
AutoMerge was initially designed to let users select and edit individual cells in an automatically merged range of cells.
Now users select the automatically merged cells as if they were spanned cells. Switch this mode on and off with a simple API call:
GC.Spread.Sheets.AutoMergeMode.SelectionMode.source
GC.Spread.Sheets.AutoMergeMode.SelectionMode.merged
Table Expand Rows API
SpreadJS v13 included a functionality that automatically expanded rows as data was added in the table. SpreadJS v14 features an API that enables or disables this feature:
table.expandBoundRows(true);
Pixel Scrolling with Scrollbar
Pixel-based scrolling was added in a previous release of SpreadJS and allowed users to scroll by a specific amount of pixels instead of the default row-by-row scrolling.
This feature is especially useful when rows in a workbook might have an immense height, and scrolling would cause the sheet to scroll more than intended.
GrapeCity enhanced this feature even further in v14. Now pixel-scrolling is affected by scrollbars and not just manually scrolling.
Fill Effects and Patterns
Fill effects and patterns for cells have been a feature of Excel but were never implemented in SpreadJS. GrapeCity introduced these features into SpreadJS v14 with added support for importing and exporting files that include fill effects and patterns.
Calculation Enhancements

GrapeCity SpreadJS v14 features an updated calculation engine with new functions and enhanced features. These enhancements include:
- The OBJECT Function
- The PROPERTY Function
- The RANGEBLOCK Function
- Iterative Calculations
- X and LET Functions
- The CONVERT Function
- Cascade Sparkline Total Column
- Header Formulas and SparklineEx
The OBJECT Function
In the SpreadJS v13 release, GrapeCity introduced the RangeCellType, which gave users the ability to define a range of cells to use as a template within a single cell. Complex layouts could be designed and incorporated with one another without worrying about trying to align column and row sizes.
SpreadJS v14 features a new OBJECT function. This function lets users define an Object from a set of property names and expressions. Objects can be used for data binding to other cells or as RangeCellType or RANGEBLOCK parameters.
OBJECT(property1, expression1, property2, expression2, ...)
- property: The property of the object, can be a cell range reference or a text string
- expression: The value of the corresponding property, can be a cell range reference or a text string
Examples:
OBJECT(A1:A3, B1:B3)
OBJECT(A1, B1, A2, B2)
OBJECT("name", "test")
The PROPERTY Function
The SpreadJS v14 PROPERTY function lets developers parse an object by its properties. The function is laid out as follows:
PROPERTY(data_expression, property_path)
- data_expression: The object data, which accepts a cell reference whose value is an object or the result of the OBJECT function
- property_path: The property path in the object, which goes through the object properties
Example:
=PROPERTY(G10, "User.Address.Home")
Use this function to inspect object properties, or use it in the Multi-Column Picker to parse the returned object into the corresponding property values.
The RANGEBLOCK Function
The RANGEBLOCK function is another new feature that works with RangeCellTypes. Use this function to implement sparklines within RangeCellTypes. Ideal for implementing dashboards and multi-row scenarios.

Cascade Sparkline Total Column
The cascade chart feature is especially useful for charting income statements and balance sheets with totals.

Header Formulas and SparklineEx
A column formula or sparkline in the header row is useful for summarizing a dataset in some cases.
Like frozen rows or columns, this feature lets developers display formulas and sparklines within headers, so they remain visible no matter where the user scrolls.

Iterative Calculations
Iterative calculations, also known as circular references, help solve specific calculations by repeatedly using the previous result. GrapeCity is excited to add this user-requested feature.
Calculate the future value of investments, or provide automatic timestamps to files. Perform what-if analysis with the CalcEngine.goalSeek function, which uses iterative calculations in SpreadJS.
X and LET Functions
These new functions include XMATCH, XLOOKUP, and LET, which allow users to create easy to read formulas and make calculations with large datasets. Compared to VLOOKUP and MATCH, XLOOKUP and XMATCH use faster algorithms and offer more flexible options.
The LET function makes it easier for users to define intermediate formulas when working with complex calculations—essentially letting users define a variable to use within the formula. This function helps simplify formulas and improve performance in the case of repeated expressions within a formula.


CONVERT Function
SpreadJS v14 now supports several new units of the CONVERT function. Units include weight and mass, distance, force, pressure, temperature, volume, area, and binary prefixes.
New Charts and Enhancements
SpreadJS v14 includes new chart enhancements and a new chart type:
- Funnel Charts
- Axis Cross Points
- Pattern Fill
- Bar/Column Chart Gap Width and Overlap
- Doughnut Chart Hole Size
- Line Break in Charts
- DataLabel Delimiter Options
Funnel Chart
SpreadJS v14 now includes funnel charts as a supported Excel chart type. Excel files exported to or imported from Excel that contain funnel charts will load those charts successfully.
These charts are best used to represent stages in a sales process to show the potential revenue in each stage. You could also show users' flow, throw an email campaign starting with emails sent out, how many of those were viewed, clicked, etc., with values typically decreasing at each level, resembling a funnel.

Axis Cross Points
Some charts represent a combination of many different charts. In such instances, the ability to choose where the X and Y-axis cross each other is valuable.
SpreadJS v14 now includes an API to set that cross point:
let axes = chart.axes();
axes.primaryCategory.crossPoint = 3;
axes.primaryValue.crossPoint = 100;
Or set these cross points with the GC.Spread.Sheets.Charts.AxisCrossPoint enumeration. Settings include automatic, maximum, or minimum.

Pattern Fill
One of Excel's chart features is the ability to add pattern fill to the charts. SpreadJS v14 now supports this feature. Apply several different patterns to the foreground or background of charts:
Bar/Column Chart Gap Width and Overlap
SpreadJS v14 column and bar charts feature two new properties: gap width and series overlap.
- gapWidth: sets space between the bar or column clusters as a percentage of the bar or column width (between 0 and 5)
- overlap: sets bar or column positions (between -1 and 1)


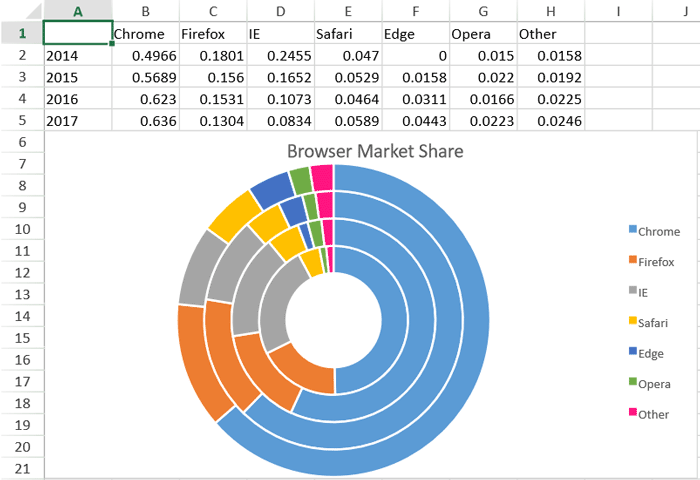
Doughnut Chart Hole Size
SpreadJS v14 lets users customize the size of the hole in their doughnut charts. Display wider slices to better accommodate data labels with long text. Set it to zero and manipulate the data to create a gauge chart for a dashboard.

Line Break in Charts
SpreadJS charts now support line breaks for the chart area, including axis labels and legend text, just like Excel.
DataLabel Delimiter Options
Chart DataLabels previously only supported commas as a delimiter. SpreadJS v14 now supports semicolons, periods, and line breaks as well.

Kevin Ashley