Pivot tables are one of the greatest features in Microsoft Excel. They allow users to extract information from large data sets quickly and easily. Wijmo's OLAP module allows you to add that functionality to your JavaScript applications with only a few lines of code. Our original implementation of OLAP worked fine, and over the years we have improved it gradually by improving its performance, flexibility, and by incorporating great suggestions from our users. This document describes some of these features and will help you keep up-to-date with the latest improvements.
OLAP New Features
One of the most important new features we've added to OLAP is documentation. We added a whole new section on OLAP to our LearnWijmo app. There you will find a description of OLAP's architecture, implementation, features, and samples. You can see how each feature is used and even play with the code.
Outline Mode
The latest version of OLAP adds an outlineMode property to the PivotGrid control. This new property allows you to display data in a more compact format and is especially useful for displaying data summaries with many row fields.
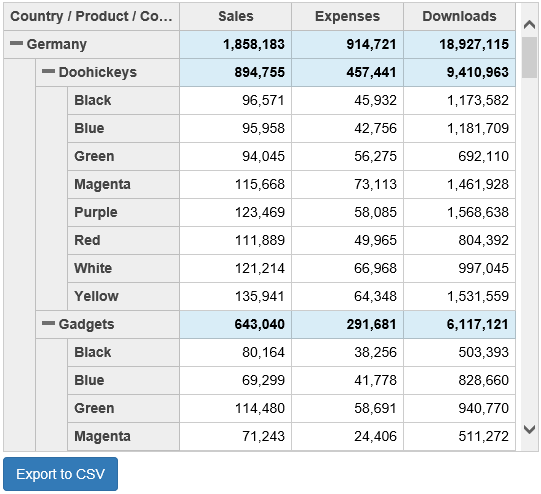
By default, the PivotGrid displays row fields as columns in the grid's row header section. This produces an output that is clean and easy to read. For example, here is a typical display of a PivotGrid showing data summarized by "Country," "Product," and "Color":

The display is easy to read, with plenty of whitespace. The problem is that the row headers take up a lot of room and may push the data summaries out of view, forcing users to scroll the grid horizontally to see the data.
This had been a limitation for a long time, and we received many requests to add an "outline mode" that would use narrower columns and merge group headers horizontally. We're very happy to announce that this feature is now available. Setting the grid's outlineMode property to true produces this output:
Notice how the row headers are narrower but still easy to read and navigate. The summary data is now visible on a single screen, and users no longer need to scroll the grid horizontally to see it. We think this new feature is a huge improvement and encourage you to take advantage of it in your applications!
Export CSV in JavaScript
Looking at data on the screen is great, but sometimes you want to export it so you can share it with others. The PivotGrid has always supported exporting to exporting to Excel and PDF, but that required additional modules and some extra code.
In the latest version, you can use the PivotGrid's getClipString method (inherited from the FlexGrid) to create CSV files that can be loaded by Excel. It's fast and easy. The getClipString method allows you to get the content of any range in the grid as a CSV string, complete with row and column headers.
The code is as simple as this:
// export to CSV
var btn = document.getElementById('csv')
btn.addEventListener('click', function(e) {
  var rng = new wijmo.grid.CellRange(0, 0,
                grid.rows.length - 1, grid.columns.length - 1),
      csv = grid.getClipString(rng, true, true, true);
  exportFile(csv, 'FlexGrid.csv');
});
Calculated Fields
Calculated fields were one of our top requests for a while. Users wanted to be able to generate fields dynamically, with values calculated from other fields.
Typical uses for this feature include:
- Measure Binning: grouping numeric values into bins of high, medium, and low values
- Dimension Binning: grouping strings into a few main categories and a catch-all "Others" category
- Arbitrary Functions: calculating values that depend on other field values, like "conversion = sales/downloads"
This feature was added a few releases back, with the introduction of the getValue method to the PivotField class.
You can see a demo in the LearnWijmo app.
Detail Dialog Customization
When users double-click a data cell in a PivotGrid, the control shows a dialog with a secondary grid that displays the detailed data used to calculate the value in that cell.
The format of the detail dialog was fixed and not easy to customize. To address this, we added a detailDialog property to the PivotGrid control. The property returns a DetailDialog object that can be used to easily customize how details are shown.
You can see a demo in the LearnWijmo app.
JavaScript OLAP Slicer Control
Excel allows you to add "slicers" to pivot tables. Slicers show lists of values and allow users to filter the data to include only one or a few values. Slicers allow users to filter data very quickly and easily, and they provide a visual display of the filter that is currently active.
Wijmo's OLAP includes a Slicer control that does the same thing. Wijmo's slicer is easy to use, efficient, and familiar.
You can see a demo in the LearnWijmo app.
Other Improvements
The latest version of the OLAP module includes many other smaller but important improvements. For example:
- PivotGrid drag support. You can now drag row field headers to update views.
- PivotGrid now honors more properties inherited from the FlexGrid, including the allowMerging and preserveOutlineState properties.
- PivotGrid has improved keyboard support. You can now collapse or expand row groups using alt-Left and alt-Right keys.
Help Improve Wijmo OLAP
We hope that you are happy with the latest improvements to the OLAP module. Please keep sending us your feedback and suggestions so the next versions will be even better!
In the meantime, please accept our thanks for the great ideas you have been sharing with us so far.

Bernardo de Castilho