Working with the ComponentOne MVC Slicer
Data slicing is powerful feature to use while interacting with data sets using OLAP. It empowers users to examine their data from different viewpoints for better understanding and analysis. Microsoft initially introduced a data slicing operation in the 2010 version of Excel.
Slicer is an UI control which allows the quick and easy filtering of data based on values for specific fields which aids in analyzing the data quickly. It displays a list of values with buttons, enabling a user to select the values and filter based on selected values.
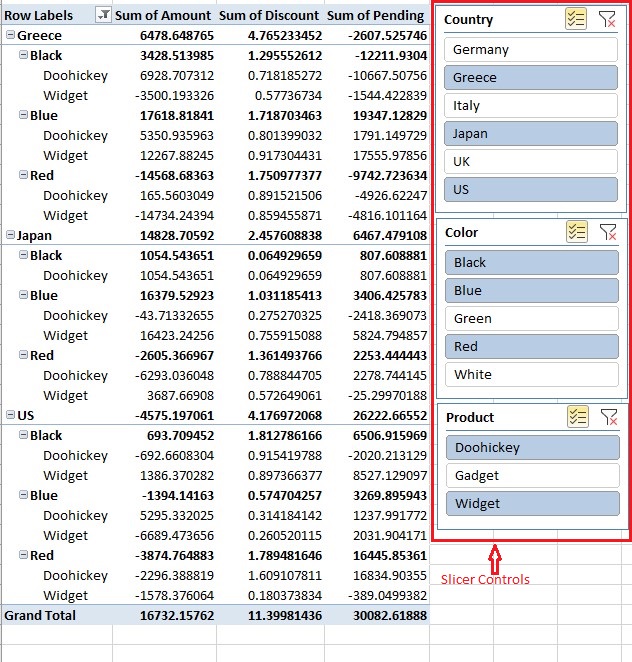
Below is an image that shows what a Slicer in Excel usually looks like.
In the ComponentOne MVC OLAP control, we can achieve the Slicer functionality by applying a filter for a field using the PivotPanel, but this requires several clicks.
A Slicer Control has been introduced in the 2019v1 release for the C1 MVC OLAP control. This control allows users to filter data with just one click per field and behaves like the Excel Slicer.
Slicers are graphical filters and can be placed anywhere in the application. Because of its placement flexibility and sizing, we may use the Slicer in various data analytics projects where C1 MVC OLAP controls are used.
Let's discuss a scenario where a Slicer could be used and how it could aid in data analysis for end users.
Let's suppose we are developing an e-commerce portal where the user would want to filter out a Product based on Brand, Color and Size and get the Price for specifically branded products based on size and color.
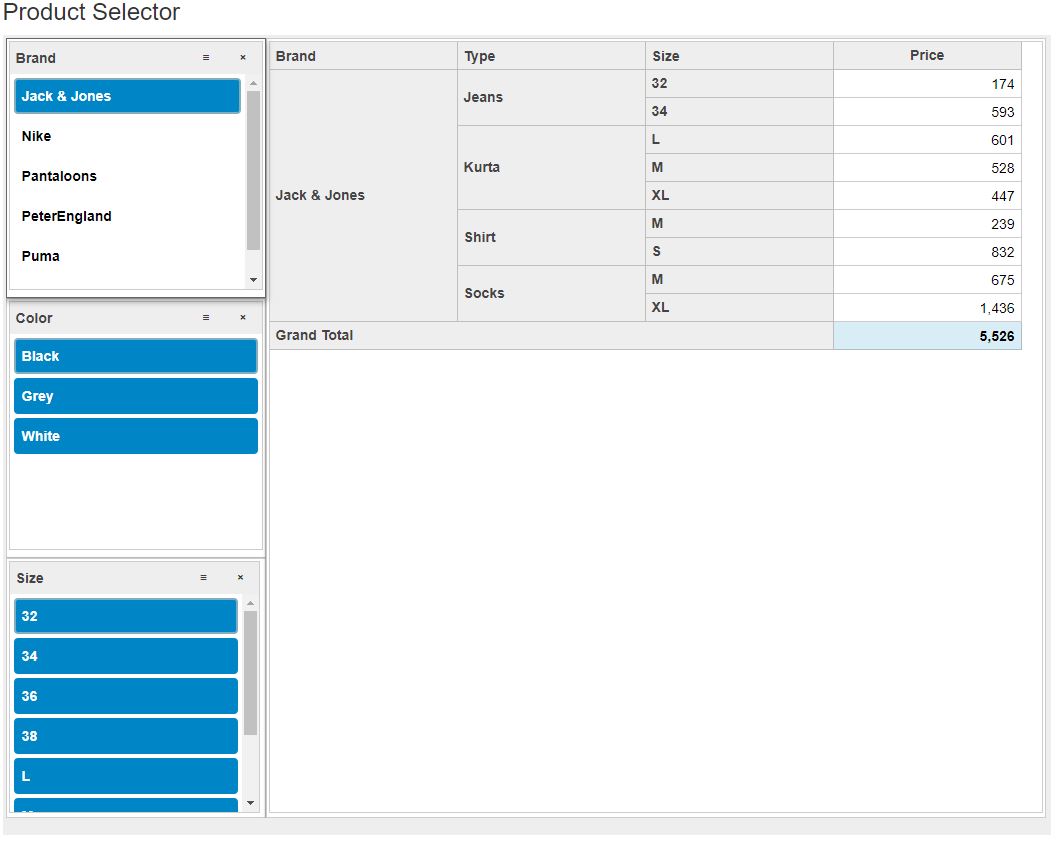
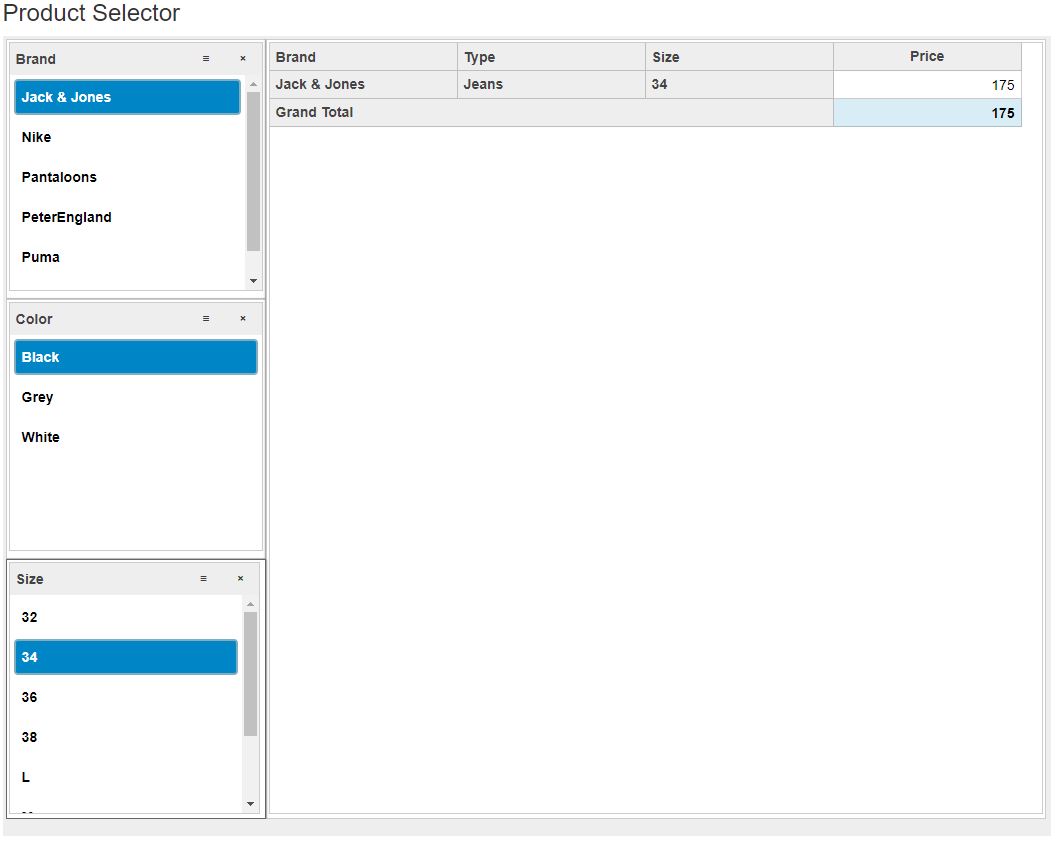
We will create a Product Selector dashboard showing the data and provide filtering based on attributes like Brand, Color and Size. For example, if the customer would like to get the Prices for various items for the "Jack & Jones" brand, the user would apply a filter for "Jack & Jones" using the Brand slicer. The user will then get the list of items with Size and Price as shown below:
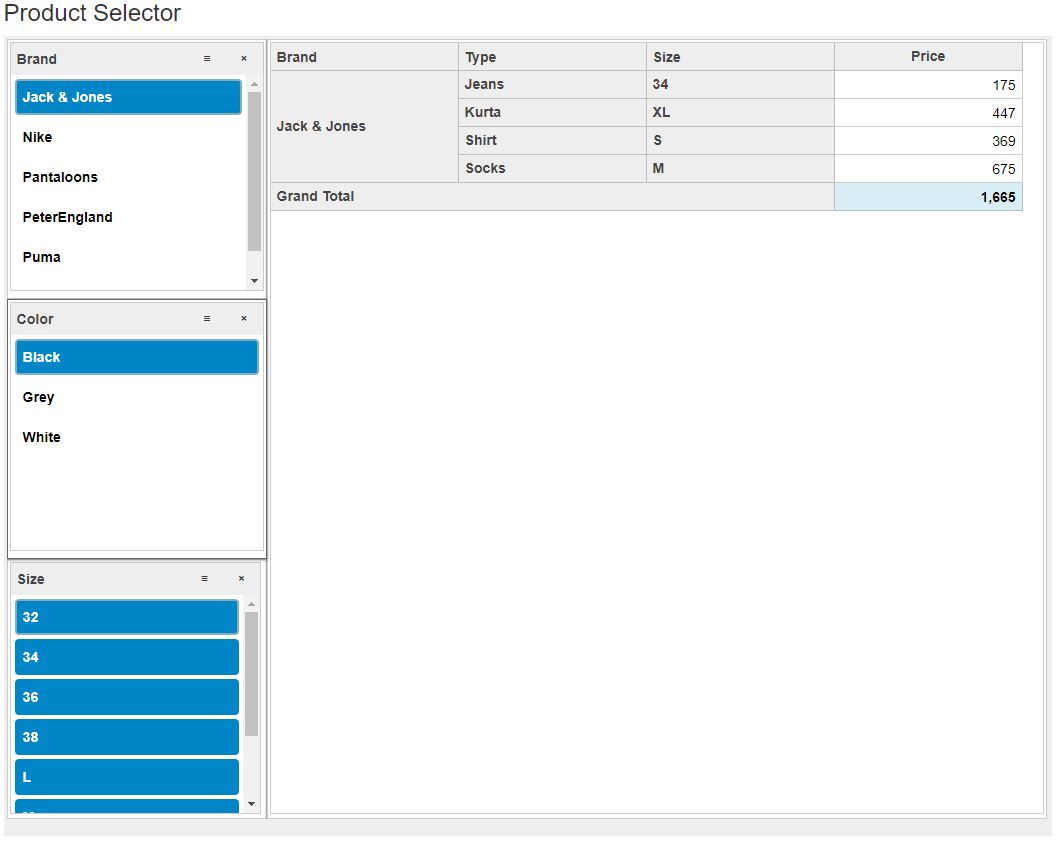
Now the user would like to filter out the items based on his favorite color to get the availability and price for each item. Here, he can apply a filter using the Color slicer which will show the items with available size and price:
Similar to the above example, the user may apply a filter for the Size Slicer to get the specified Size items availability and price:
To create the Product Selector Dashboard, we need following controls:
- Slicer
- PivotEngine
- PivotGrid
We'll create an MVC Application using these Controls to create the Dashboard using the following steps.
Step 1: Bind data with PivotEngine
PivotEngine accepts the raw data, transforms it, and provides the pivot data for the defined fields. This can then be used as a data source for the C1 OLAP controls Slicer, PivotGrid. PivotEngine internally creates PivotFields based on the fields in data.
@(Html.C1().PivotEngine()
                .Bind(Model)
                .RowFields(vfcb => vfcb
                    .Items("Brand", "Type", "Size"))
                .ValueFields(vfcb => vfcb
                    .Items("Price"))
                .Id("engine"))
Step 2: Bind PivotEngine with Slicer and PivotGrid
Now that we have created the PivotEngine instance, we will bind PivotEngine to PivotGrid and Slicer to display data and allow filtering.
After providing the data source to Slicer control, we need to set the Field Property for the Slicer Control.
The PivotGrid is used to show the pivot and filtered data while using Slicers. In order to show pivot data in PivotGrid, PivotEngine provides three fields – rowFields, columnFields, and valueFields which contain the field collection to display the records in PivotGrid's rows, columns, and cells respectively.
@(Html.C1().Slicer().Field("Brand").Header("Brand").MultiSelect(false).PivotEngineId("engine").Id("Brand").Width("100%").Height("99%"))
@(Html.C1().Slicer().Id("Color").PivotEngineId("engine").Field("Color").Header("Color").MultiSelect(false).Width("100%").Height("99%"))
@(Html.C1().Slicer().Field("Size").Header("Size").MultiSelect(false).PivotEngineId("engine").Id("Size").Width("99%").Height("100%"))

@(Html.C1().PivotGrid().CollapsibleSubtotals(false).IsReadOnly(true).ItemsSourceId("engine").AllowSorting(true).Width("100%").Height("100%").Id("grid").QuickAutoSize(true))
Step 3: Align the Slicer(s) and PivotGrid in Dashboard
After adding the PivotEngine, PivotGrid, and Slicers to the page, we will now add them to the Dashboard to show the PivotGrid and Slicers.
Now that the code has been added to the project and it's ready to run, here's a GIF image that demonstrates the Filtering operation using the Slicer Control.
Download the Sample
Thanks for following along. If you have any questions, comments or issues related to this tutorial, please leave them in the comments below.
Happy Coding!

Manish Gupta