80+ Chart Types, Flexible ASP.NET MVC Chart Controls
Enhance your data visualizations with 80+ chart types for enterprise apps and dashboards. ComponentOne FlexChart for ASP.NET MVC includes:
- Built-in features for end-user interaction, data analysis and modern styling
- Extensive and flexible API for precise customization
- State of the art SVG or WebGL browser rendering
- ASP.NET Core and .NET 6 support
DOWNLOAD FREE TRIAL
Overview
ASP.NET MVC chart controls are UI libraries for creating and displaying 2D charts in web applications. ComponentOne FlexChart provides bar, line, area, and many other chart types to help developers visualize data in meaningful ways.
Why Choose FlexChart for ASP.NET MVC?
80+ Chart Types and Variations
Build the exact ASP.NET chart you need with FlexChart's many built-in chart types, combination plots, and stacking options.
Specialized Chart Components
Get optimized ASP.NET MVC chart components for pie, radar, polar, sunburst, treemap, and financial charts.
Create Interactive Dashboards
Bring your data visualizations to life with interactive features like scrolling, zooming, selection, and drill-down.
Built-in Analysis Features
Write less code with built-in data analysis features such as waterfall series, error bars, and trendlines.
Flexible Customization
FlexChart exposes flexible event handlers and properties that allow custom styles for data points and labels.
Extensive Server and Client-side API
Write code on the server or client-side with an extensive API that allows you to customize the ASP.NET MVC chart.
Save and Load User Charts
Serialize your ASP.NET MVC charts to JSON or XML formats so end-users can save and load them with ease.
Fast WebGL Rendering
Load very large data sets, up to hundreds of thousands of data points, without sacrificing performance.
ASP.NET MVC Chart Types
Bar and Column Charts
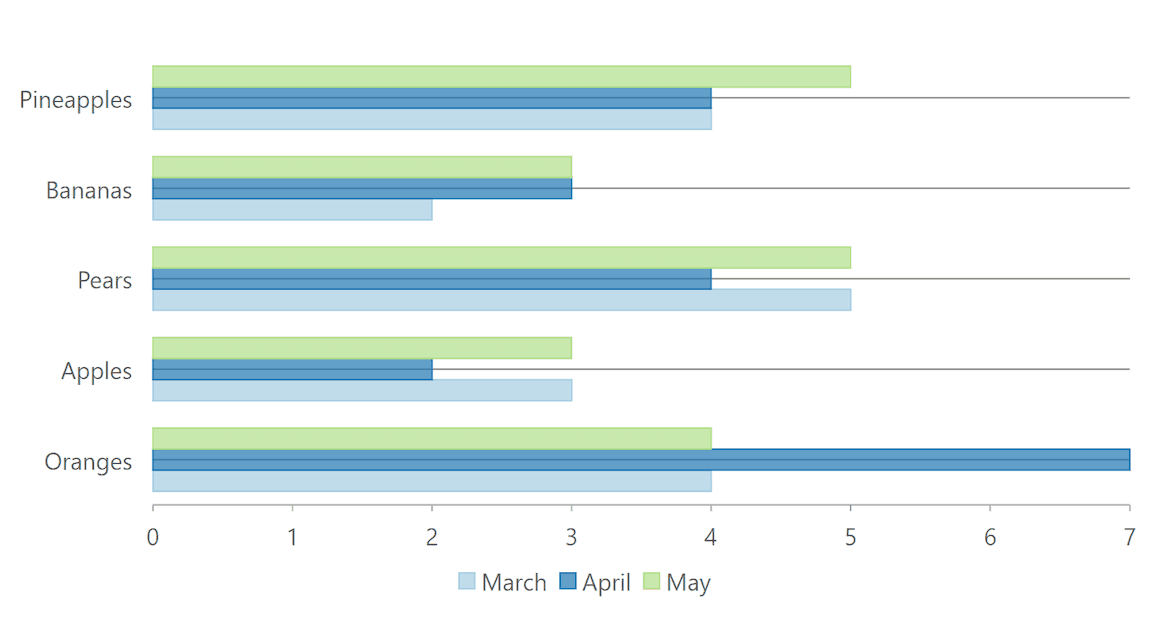
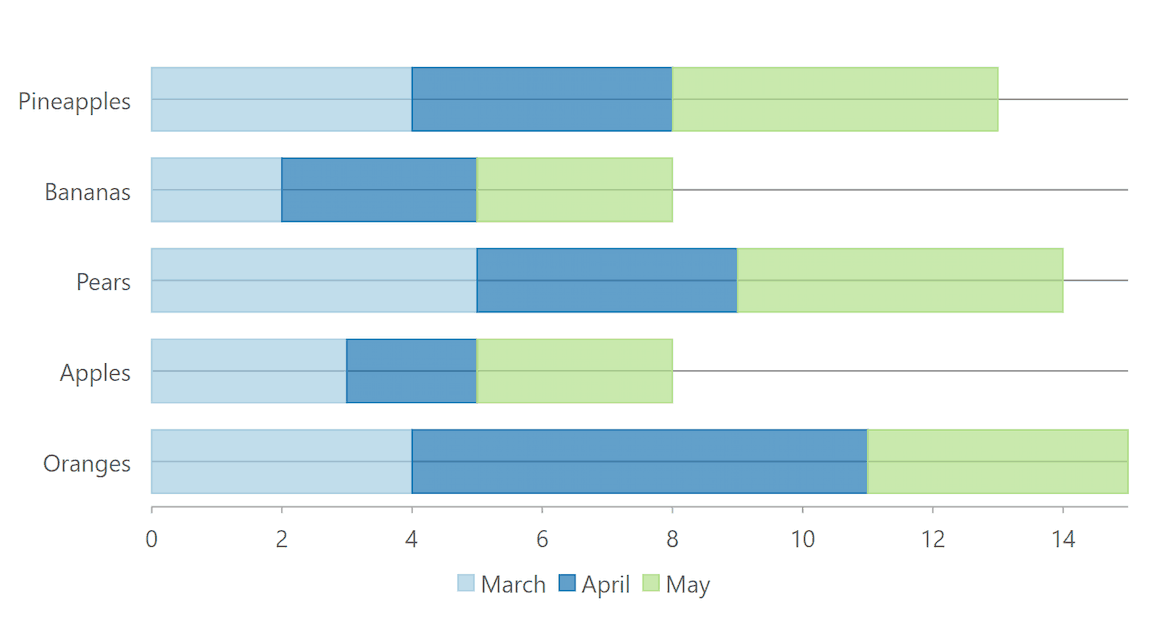
Bar Stacked Charts
Stack data points in a MVC bar chart. Plots data points on top of each other using horizontal bars.
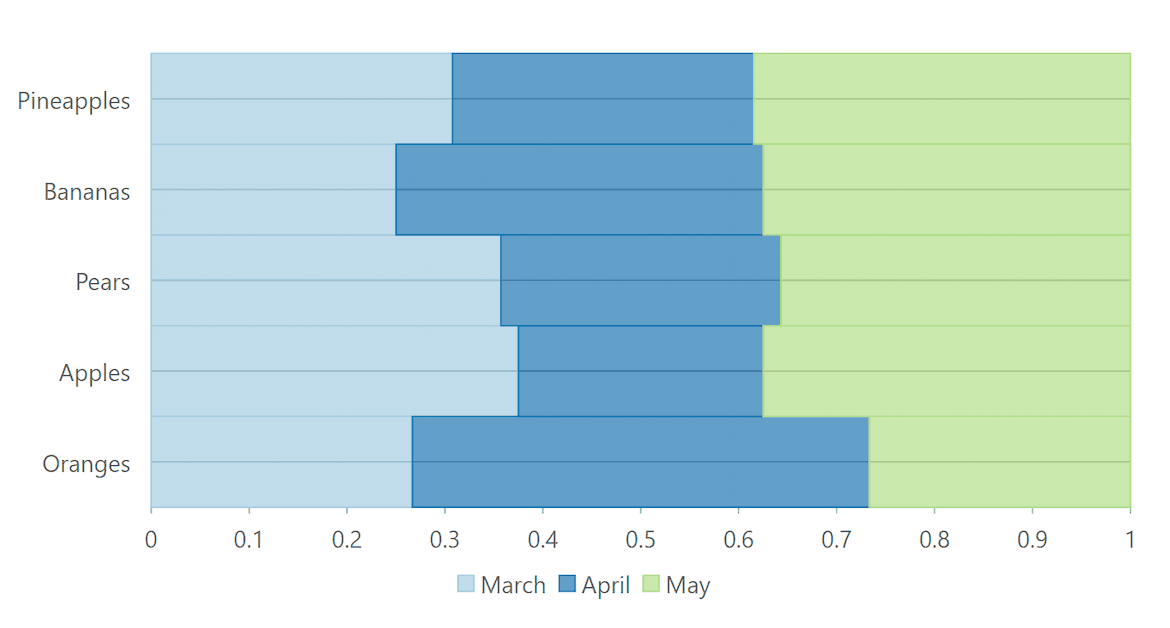
Bar Stacked 100 Charts
Compare percentages for each value within the total. The cumulative proportion of each stacked column always totals one hundred percent.
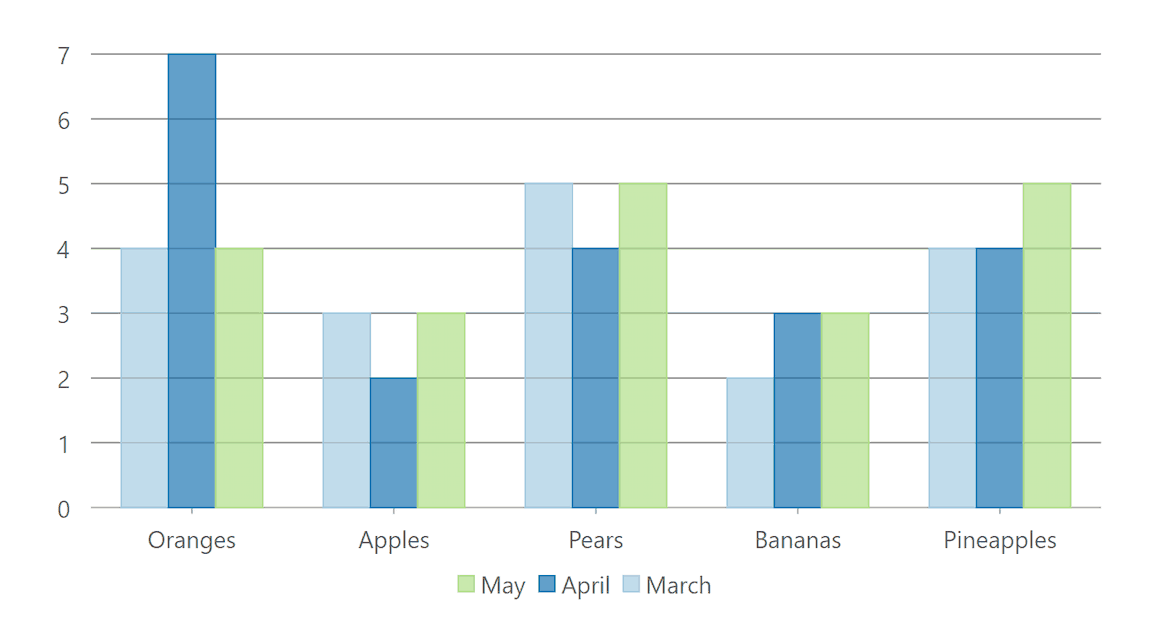
Column Charts
Similar to a bar chart, with a primarily vertical orientation. MVC column charts compare values across categories by using vertical bars.
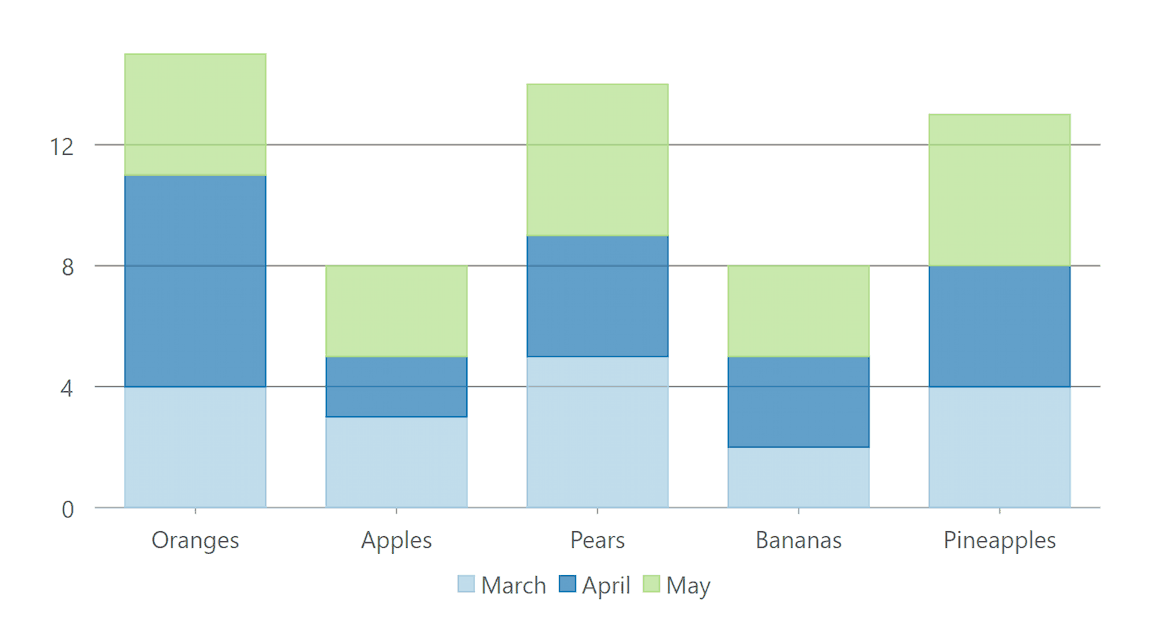
Column Stacked Charts
Stack and plot data points in a column chart using vertical bars. To stack the chart values, set the FlexChart stacking property.
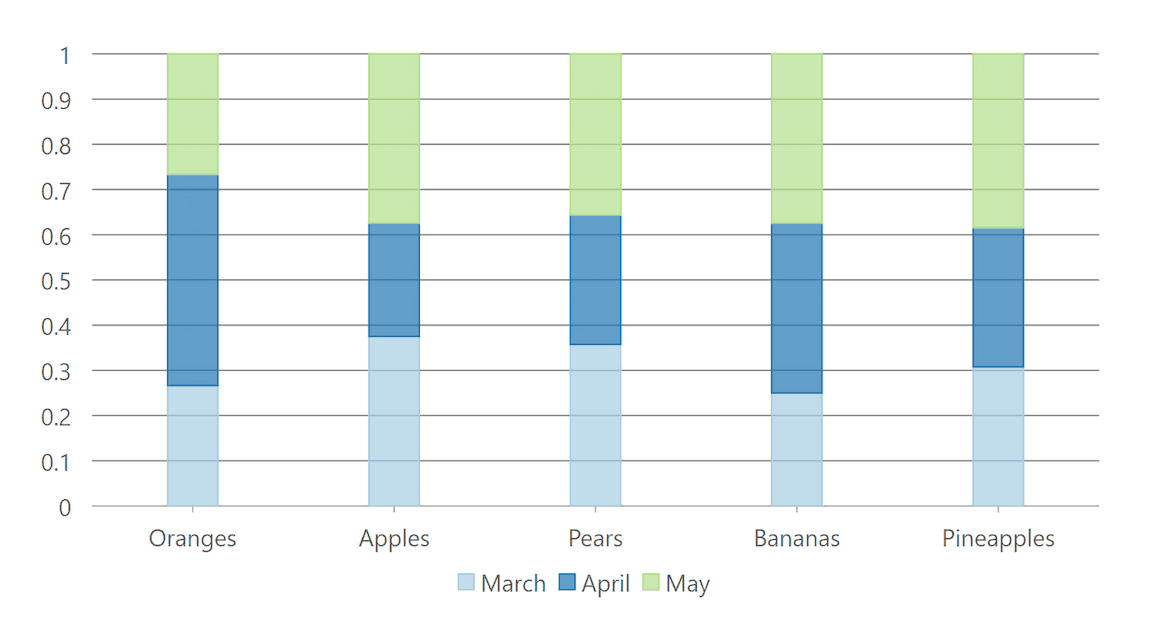
Column Stacked 100 Charts
The cumulative proportion of each stacked column always totals one hundred percent. Compare the percentage each value contributes to the total.
Line and Area Charts
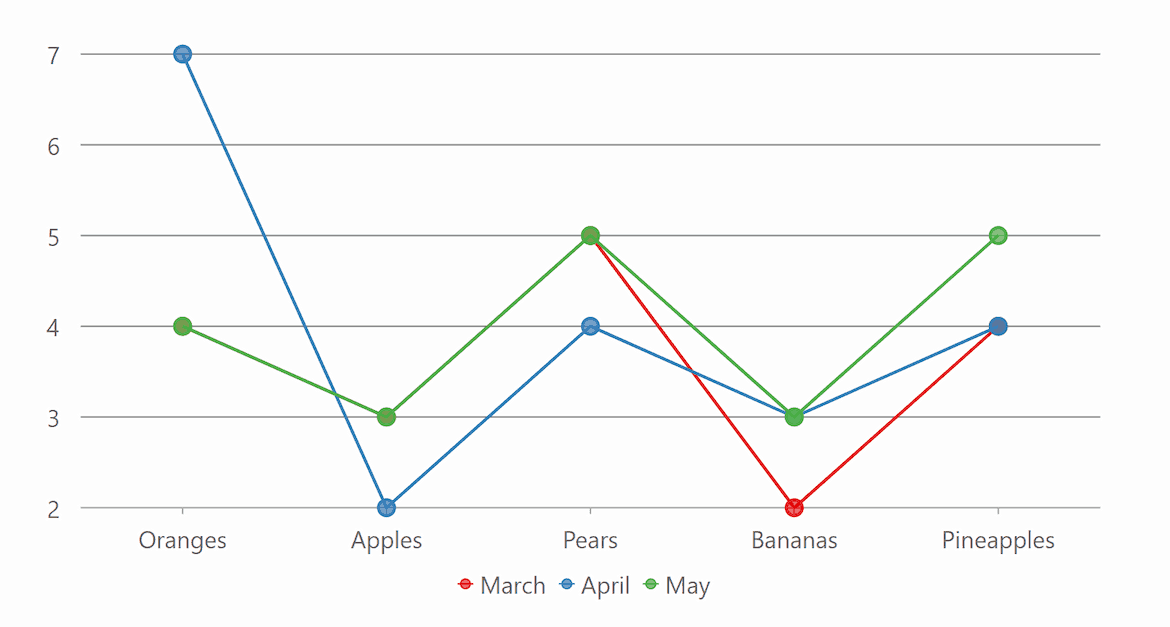
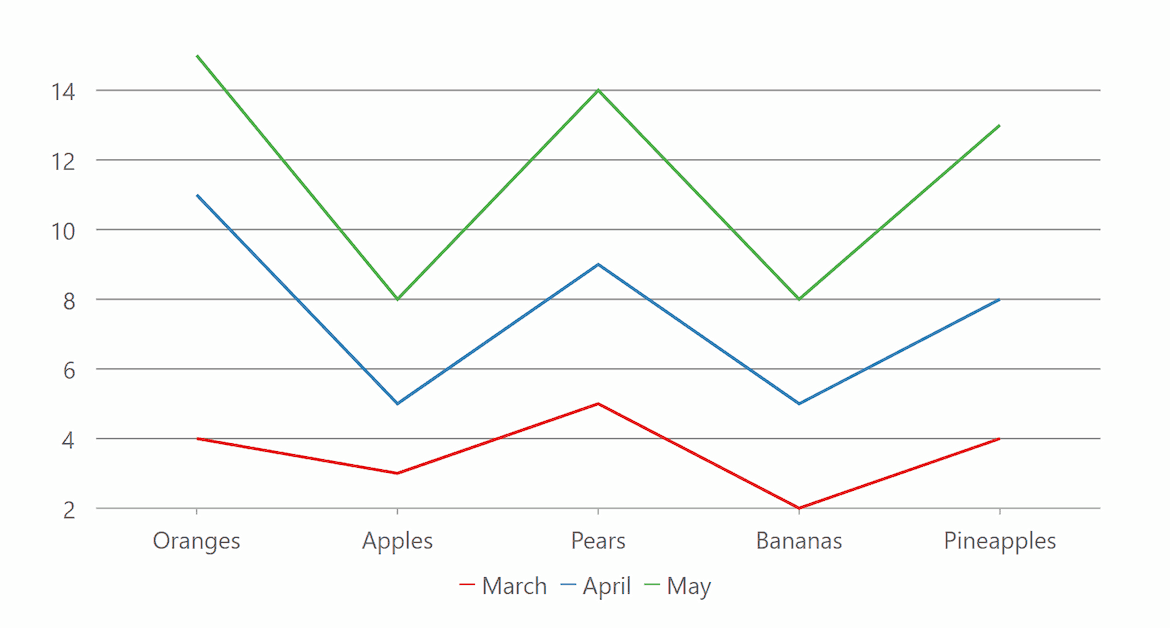
Line Charts
Display changes in data over short and long periods of time with a basic line chart with optional symbols.
Line Stacked Charts
Stacked line chart series do not overlap because they are cumulative at each point and ideal for visualizing the overall total.
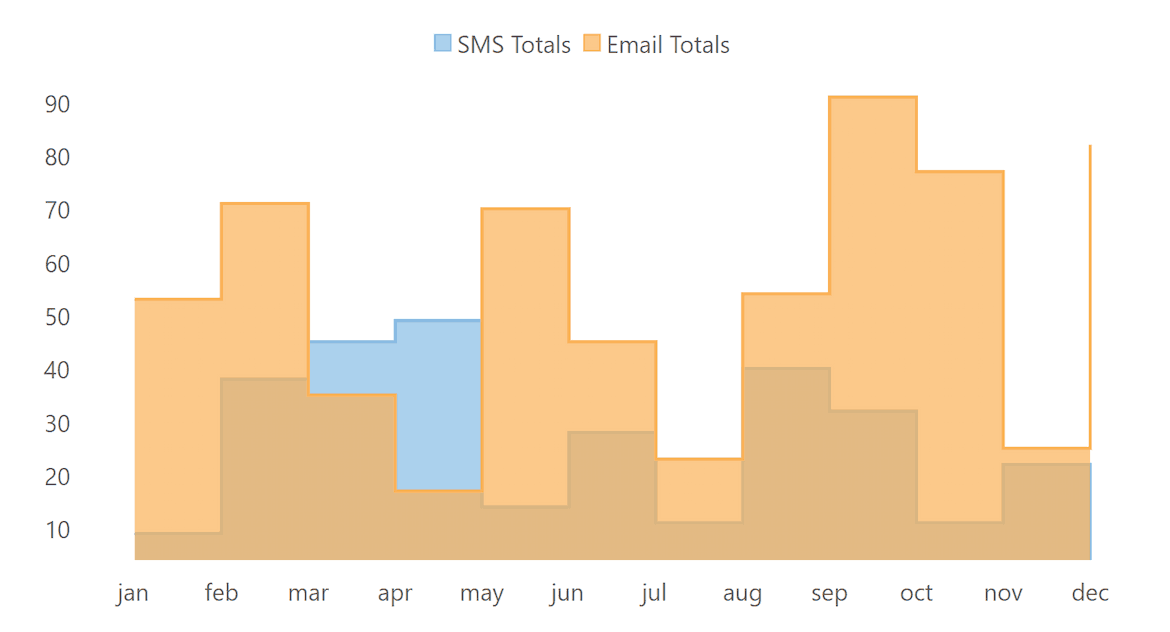
Step Charts
Step line charts help visualize changes at a specific point. Data points are connected through vertical and horizontal lines. Display symbols or fill the area.
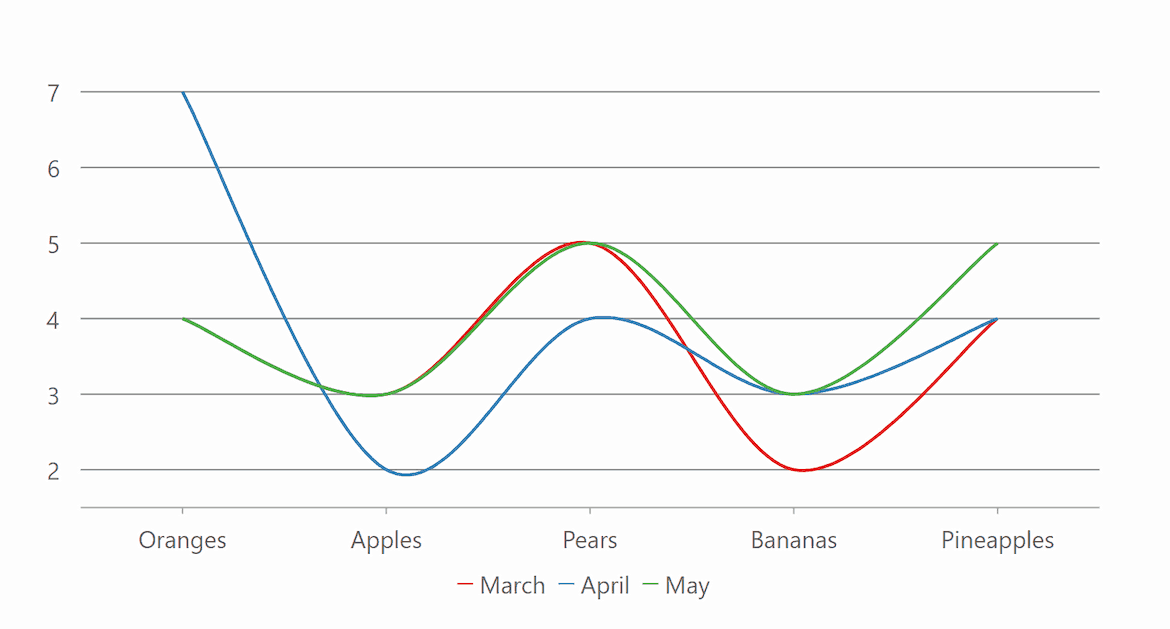
Spline Charts
Spline charts connect the data points with smooth lines and use numeric, category, datetime, or logarithmic axis to plot data. MVC spline charts support symbols, stacking, and axis rotation.
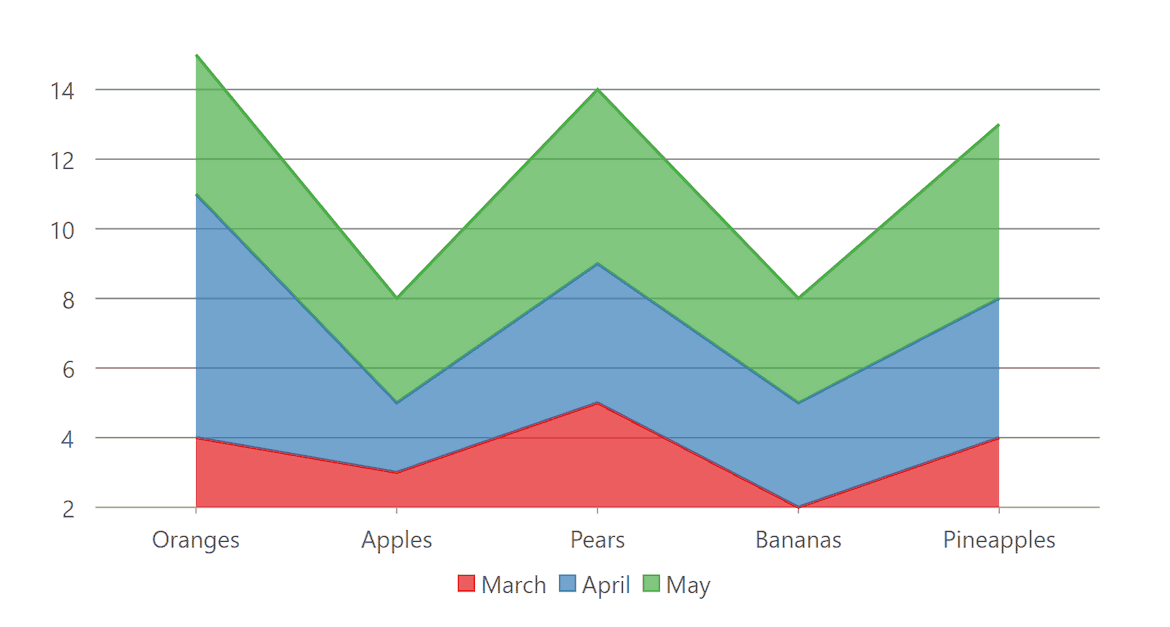
Area Charts
Fill in the area below the line to demonstrate trends in similar categories. MVC area charts support stacking, spline, and axis rotation.

Range Area Charts
Fill in the area below the line to demonstrate trends in similar categories. Shows variations in the data values for a given time.
Scatter Charts
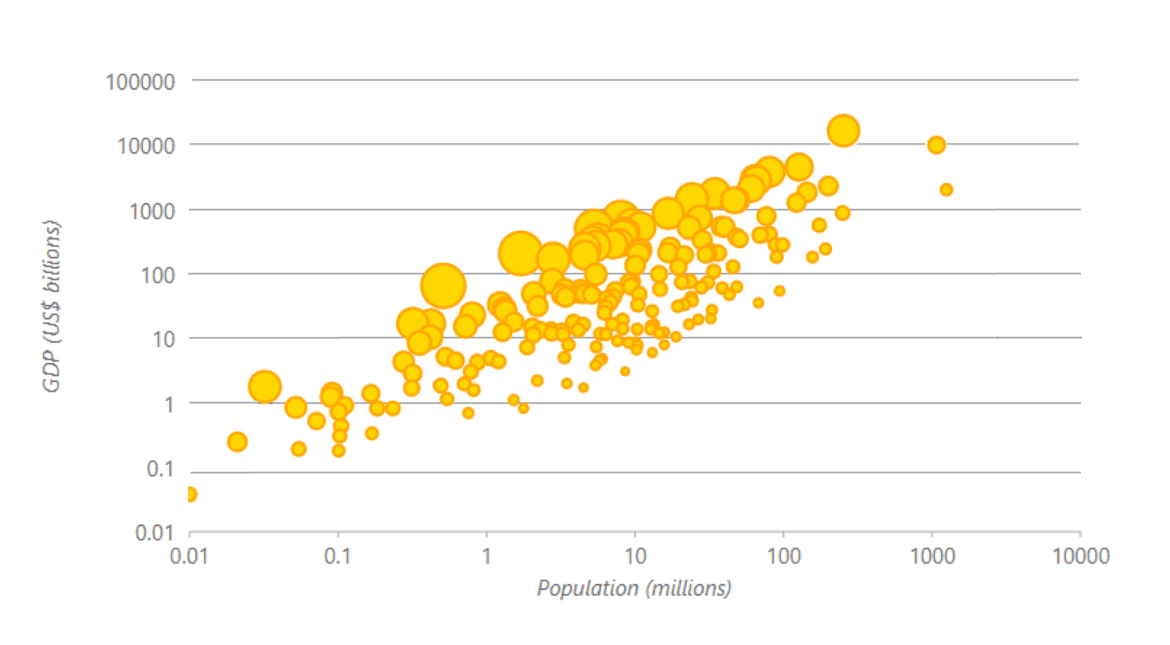
Bubble Charts
Create rich, visually appealing data modeling and financial charts with bubble charts. This ASP.NET MVC chart allows you to display your data series as a set of differently-sized symbols in the chart space.
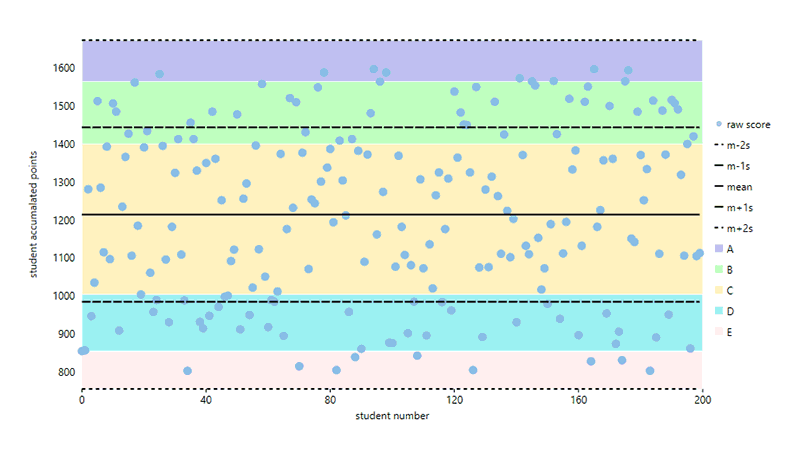
Scatter Charts
Demonstrate correlation between data points and a set of numerical data along the x-axis and the y-axis. Scatter charts combine values into single data points and display uneven intervals or clusters.
Financial Charts

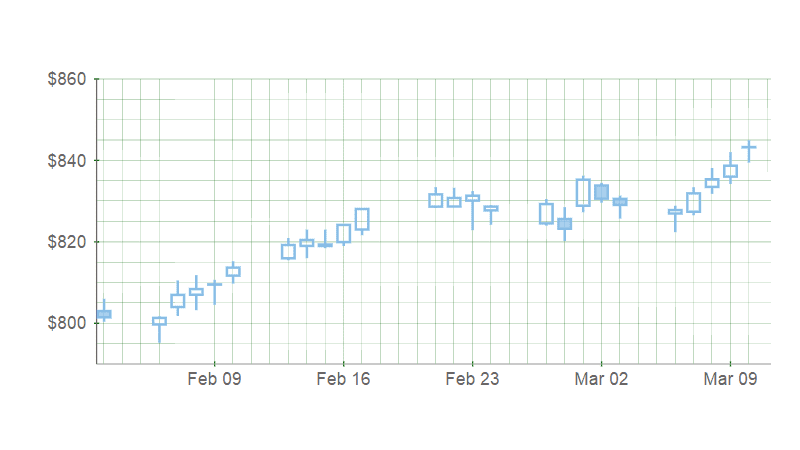
Candlestick Charts
The candlestick chart displays the Open, Close, High, and Low Stock Prices for each day in the series. The vertical bar spans the High and Low values for the day.

HLOC Charts
Also known as high-low-open-close, HLOC charts illustrate movements in the price of a financial instrument over time.

More Financial Charts
Studio Enterprise includes FinancialChart, which includes 9 additional chart types including Heikin-Ashi, Kagi, Renko and more.
Pie and Sunburst Charts

Pie Charts
ASP.NET pie charts show how parts of a whole add up to 100%. FlexPie features include doughnut, exploded slices, animation, selection, and rotation.

Sunburst Charts
Visualize hierarchical data from a root node (center) outward to lower hierarchies. A segment of the inner circle is a parent to the segments of the outer circle which lie within the angular sweep of a parent.

Multiple Pie Charts
Use FlexPie to visualize more data in a single chart by creating multiple pie chart "series" using the same data source. An effective way of presenting data, especially if the intent is to show one section relative to the whole.
Radar and Polar Charts

Radar Charts
Display multivariate observations with an arbitrary number of variables. FlexRadar supports line, area, column, scatter and stacked chart types.

Radar Area Charts
Fill in the areas between lines of a basic radar chart. Overlapping series can be visualized with semi-transparent colors.

Radar Column Charts
Create a windrose chart using FlexRadar and the Column chart type. This visualization lets you display changes in the radar through radiating columns with stacking support.

Polar Charts
Create circular graphs to display multivariate observations with an arbitrary number of variables. Visually compare several quantitative or qualitative aspects of a situation. FlexRadar can generate polar charts with lines, columns, filled areas and custom symbols.
Specialized ASP.NET MVC Charts

Error Bar Charts
Error bars help you see margins of error and standard deviations at a glance. They can be shown as a standard error amount, a percentage, or a standard deviation.

Box-and-Whisker Charts
Graphically depict groups of numerical data through their quartile, mean, median, and outliers.

Funnel Charts
Visualize stages of a process, such as a sales funnel, using a funnel shape. Adjust the funnel's height, width, and style using the options property.

Funnel Rectangle Charts
Square the edges in a funnel for a different look that plots streamlined data to show various stages in a process.

Waterfall Charts
A waterfall chart helps understand the cumulative effect of sequentially introduced positive or negative values. Optionally, display auto-calculated intermediate totals in the waterfall chart.

Gantt Charts
Manage a project with a Gantt chart and never miss a step. Includes dependencies and percent complete, start and end dates for each task, and information such as completion states and task dependencies.

TreeMap Charts
Display hierarchical information combined with relative quantity. Highlight hierarchical, tree-structured data as a set of nested rectangles and help to analyze the anomalies in the data set.
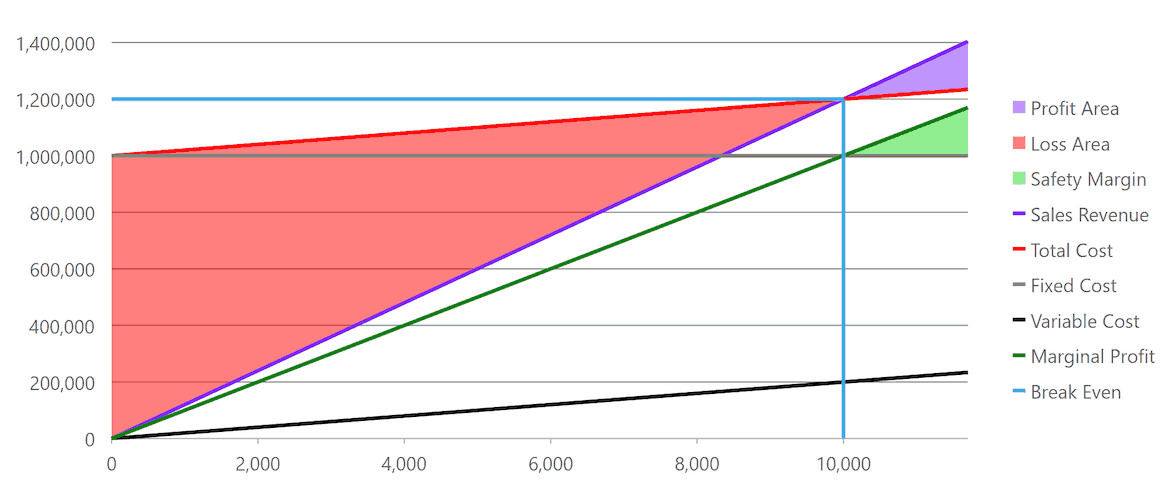
BreakEven Charts
A break-even chart shows the sales volume level at which total costs equal sales. The chart plots revenue, fixed costs, and variable costs on the vertical axis, and volume on the horizontal axis.
Chart Features
Interactive Features
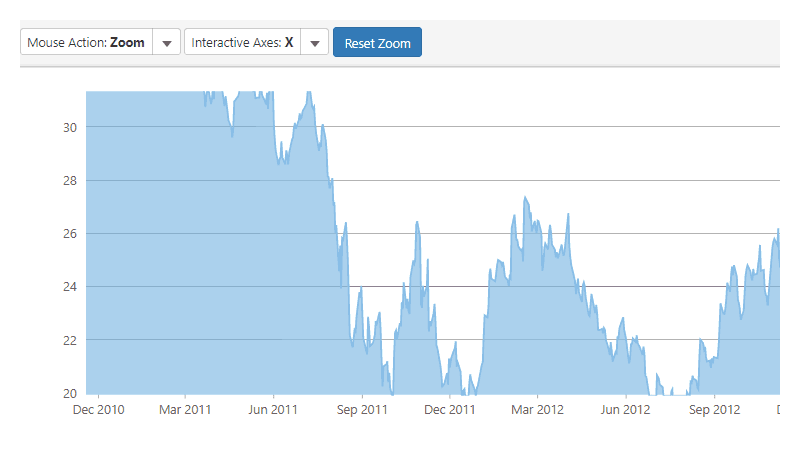
Zooming and Panning
Interact with the chart using mouse or tap gestures. Use pinch gesture, mouse wheel or double click to zoom in/out.

Line Markers
Add interactive line markers or cross-hairs to show information about a specific point on your chart.

ASP.NET MVC Chart Style Features

Built-in Color Palettes
Quickly choose one of FlexChart's 12 built-in color palettes including sequential, diverging and qualifying palettes which are helpful in visualizing ordered or diverging data sets. Or customize your own palette with full gradient support.

Custom Data Points
FlexChart allows you to customize each data point's appearance by changing the style, shape or color. Use the ItemFormater property to customize the appearance of the data points calculated based on their values being plotted.
Custom Axes and Gridlines
Configure the chart axes and gridlines to your desired specifications. FlexChart supports multiple axes, major and minor gridlines, tick marks, axis origin, reversed axes, rotated axis labels, logarithmic scaling and more.
Additional Features

High Performance WebGL Rendering
By default, FlexChart renders all elements using SVG which is great for interactivity. But for better performance, you may also choose WebGL rendering.

Composite Charts
Combine different chart types in the same plot using one or more Y axis. FlexChart allows you to customize the chart type for each series.

Multiple Plot Areas
Define multiple plot areas to display plots stacked horizontally and vertically. Stacking plot areas helps visualize multiple series in a single chart.

Range Selector
Let your users drill-down into a section of the data set while keeping the full data on display using our range selector feature. Select a range of data on one chart to filter the larger chart.

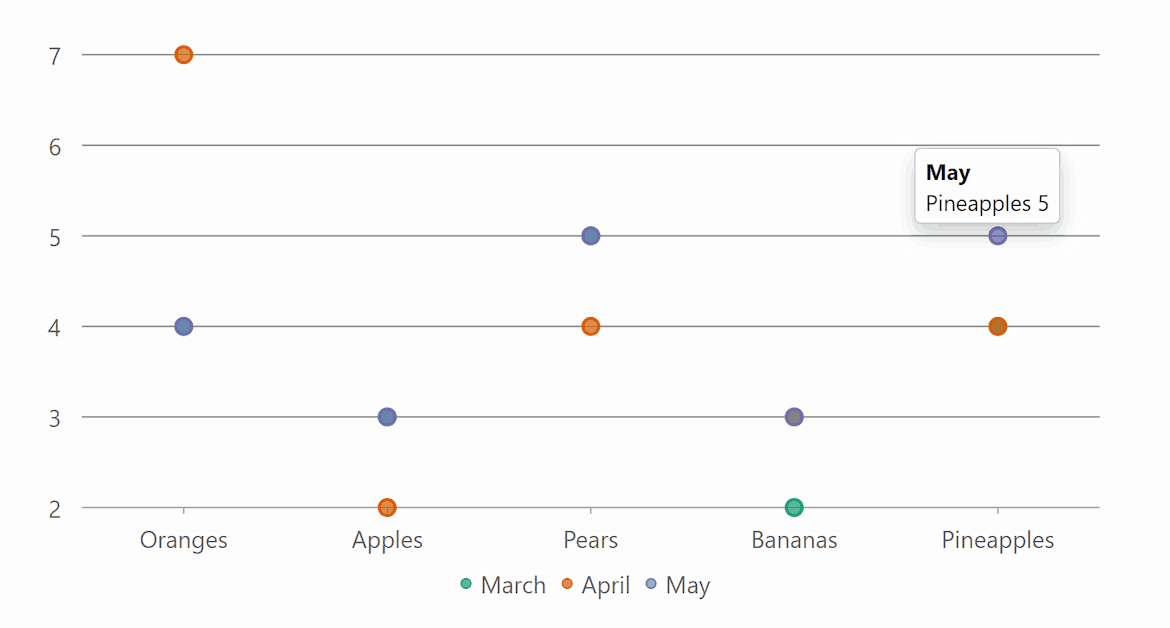
Data Labels and Tooltips
Display precise chart values in labels attached to each data point. FlexChart can automatically display the formatted value or percentage within labels and tooltips, but you can customize the style and layout.
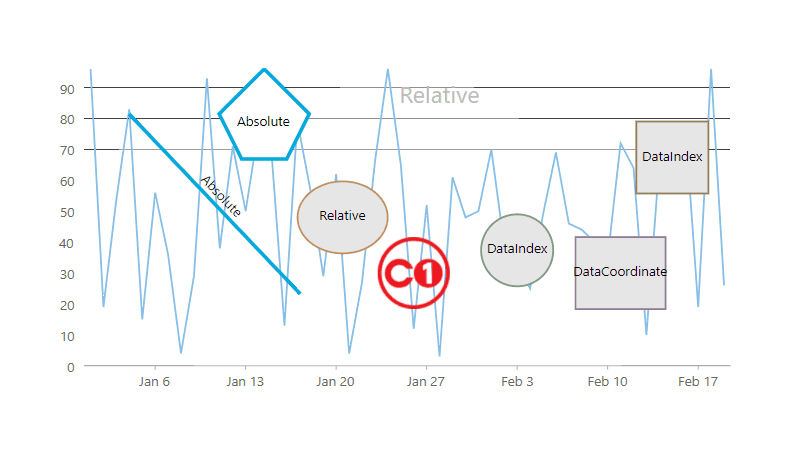
Annotations
Annotations improve the clarity of the chart using arbitrary text, images and shapes that can be attached to data points or plot coordinates. You can even allow end-users to edit annotations in FlexChart.
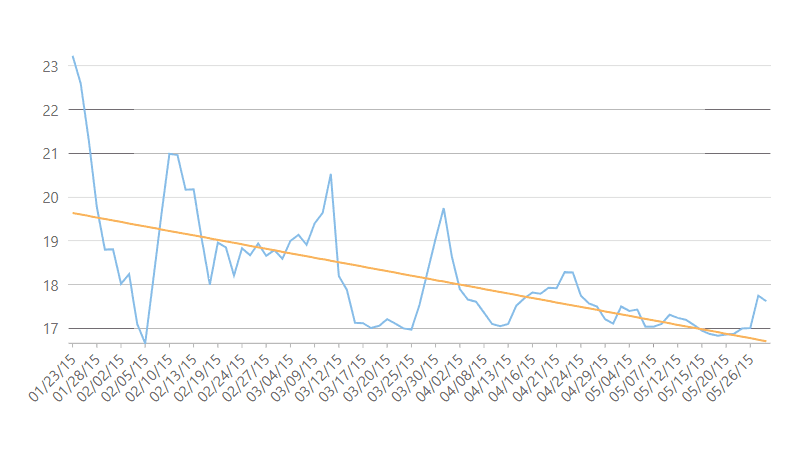
Trendlines
Add trend lines to show trends in data and make predictions. FlexChart supports several built-in regression and non-regression trendlines such as linear, average, and polynomial.
ASP.NET MVC Chart Demos

ASP.NET MVC Control Explorer
Explore every key feature and discover new ones in the ASP.NET MVC Control Explorer.
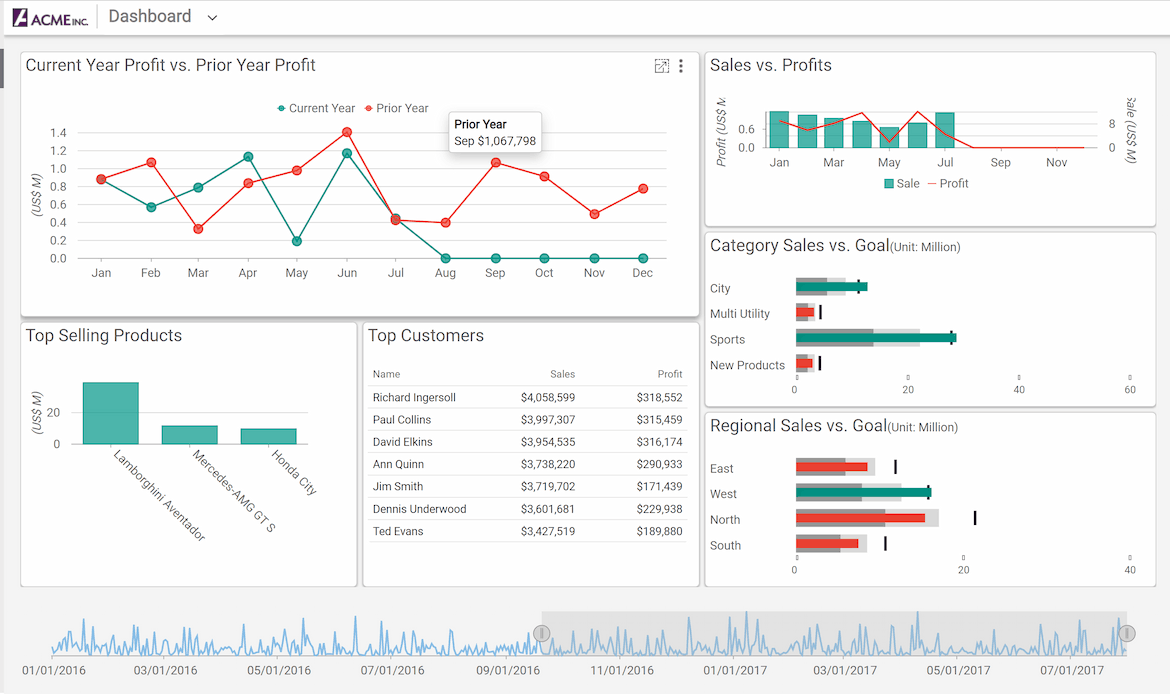
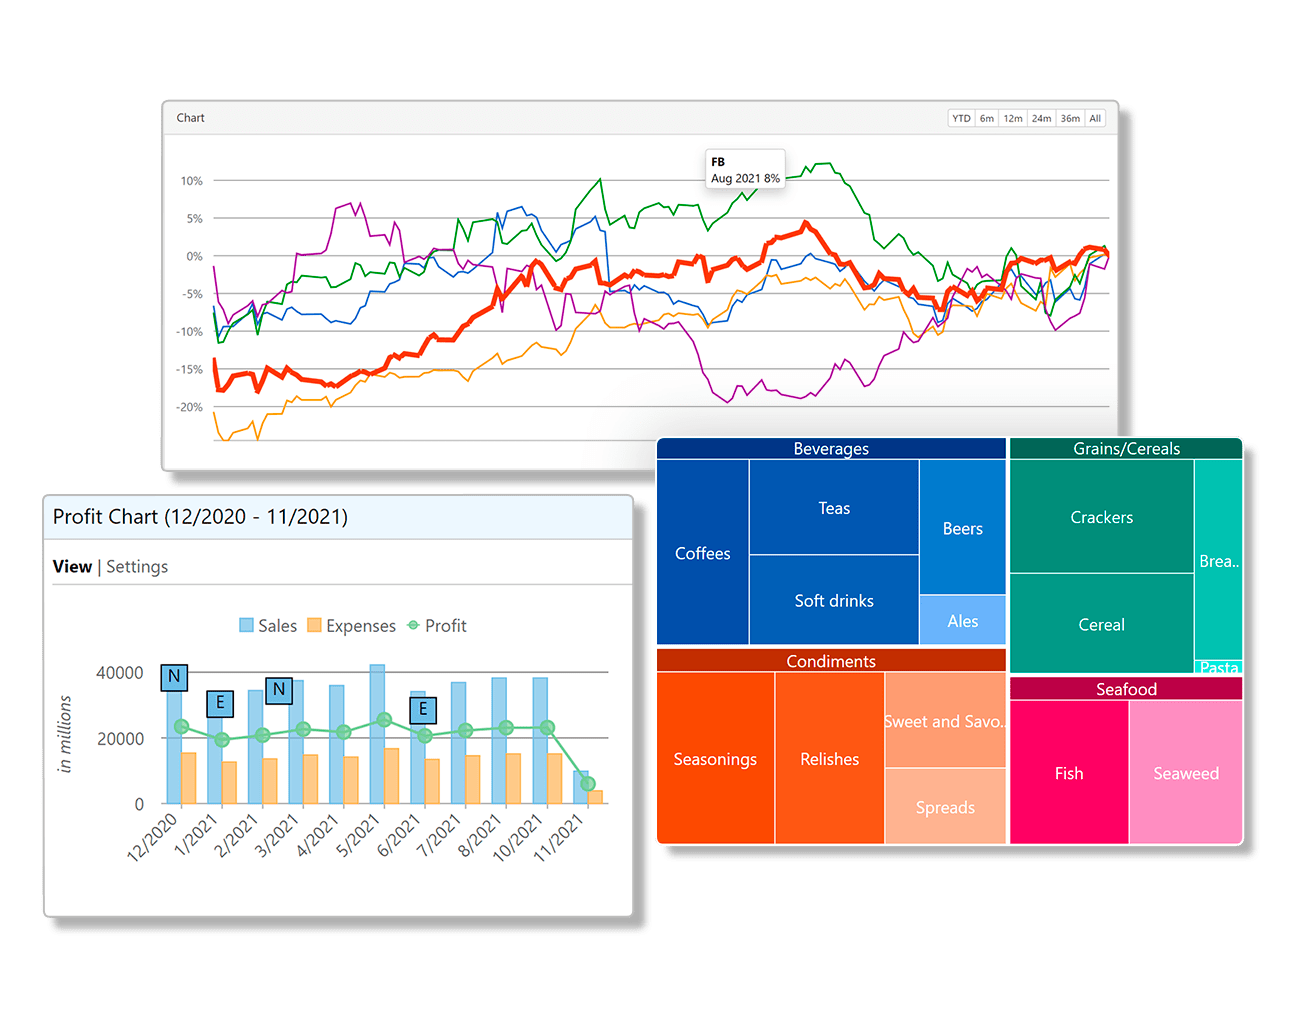
BI Dashboards
Build business intelligence dashboards with the Dashboard Layout control. Embed controls like FlexGrid and FlexChart with built-in layouts. Users can resize and move controls with ease.

Flight Statistics Dashboard
Experience this responsive dashboard demo that showcases several ComponentOne controls. Drill into information by clicking a chart node. Add custom icons, sparklines, and conditional formatting.
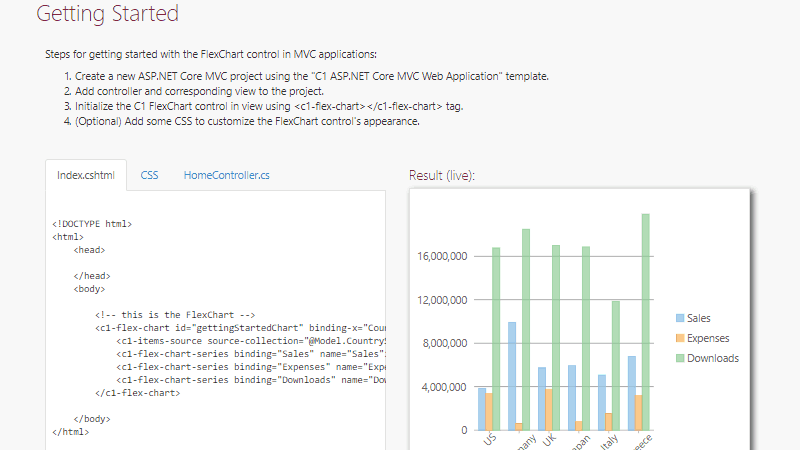
ASP.NET MVC FlexChart 101
These tutorials get you started with MVC Chart's chart types and interactions.

ASP.NET MVC FlexPie Chart 101
These tutorials get you started with ASP.NET MVC FlexPie, a flexible MVC pie chart.

ASP.NET MVC FlexRadar Demos
View the FlexRadar control which is a specialized ASP.NET MVC chart component for radar and polar charts.


