Although a chart contains primary X and Y axes, you may still sometimes require additional axes to fulfill your requirements. For example, you may want to plot series of a significantly different range of values in a chart. In addition, you may want to plot entirely different values (of different types) within a single chart. With just two axes, it would not be possible to display data in such scenarios effectively. In such cases, using secondary axes would come in handy. To use secondary axes, you can plot multiple series in a single chart with their own X and Y axes.
FlexChart allows you to add secondary axes when you add multiple series to the chart. The scale of a secondary axis represents the values of its associated series. You can even change the ChartType of the associated series to easily identify the values plotted along the secondary axis.
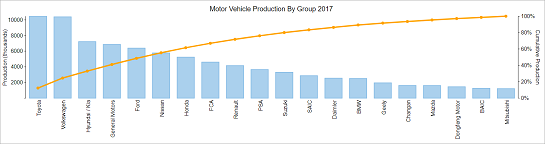
The following image shows two Y axes, one primary and another auxiliary, along with X axis in FlexChart.
The following code example demonstrates how to add two Y axes to the FlexChart.
| Index.razor |
Copy Code
|
|---|---|
@using C1.Chart; @using C1.Blazor.Chart; <FlexChart Class="chart" ChartType="ChartType.Column" HeaderContent="Motor Vehicle Production By Group 2017" HeaderStyle="font-size:20px" BindingX="Group" ItemsSource="Data"> <SeriesCollection> <Series Binding="Number" /> <Series ChartType="ChartType.LineSymbols" Binding="Cumulative" AxisY="Y2" Style="fill:orange;stroke:orange;stroke-width:4" SymbolSize="8" Tooltip="{Cumulative:p0}"/> </SeriesCollection> <AxisCollection> <Axis AxisType="AxisType.X" Position="Position.Bottom" LabelAngle=90 AxisLine=false TickLength=5 MajorTickMarks="TickMark.None" /> <Axis AxisType="AxisType.Y" Title="Production (thousands)" Format="#," Position="Position.Left" /> <Axis AxisType="AxisType.Y" Name="Y2" Format="p0" Min=0 Title="Cumulative Production" Position="Position.Right" MajorUnit=0.2 /> </AxisCollection> </FlexChart> @code { List<DataSource.ProductionData> Data { get; set; } protected override void OnInitialized() { Data = DataSource.GetData(); } public class DataSource { public class ProductionData { public string Group { get; set; } public int Number { get; set; } public double Cumulative { get; set; } } public static List<ProductionData> GetData() { var data = new List<ProductionData>() { new ProductionData { Group = "Toyota", Number= 10466051}, new ProductionData { Group = "Volkswagen", Number= 10382334}, new ProductionData { Group = "Hyundai / Kia", Number= 7218391}, new ProductionData { Group = "General Motors", Number= 6856880}, new ProductionData { Group = "Ford", Number= 6386818}, new ProductionData { Group = "Nissan", Number= 5769277}, new ProductionData { Group = "Honda", Number= 5235842}, new ProductionData { Group = "FCA", Number= 4600847}, new ProductionData { Group = "Renault", Number= 4153589}, new ProductionData { Group = "PSA", Number= 3649742}, new ProductionData { Group = "Suzuki", Number= 3302336}, new ProductionData { Group = "SAIC", Number= 2866913}, new ProductionData { Group = "Daimler", Number= 2549142}, new ProductionData { Group = "BMW", Number= 2505741}, new ProductionData { Group = "Geely", Number= 1950382}, new ProductionData { Group = "Changan", Number=1616457}, new ProductionData { Group = "Mazda", Number=1607602}, new ProductionData { Group = "Dongfeng Motor", Number=1450999}, new ProductionData { Group = "BAIC", Number=1254483}, new ProductionData { Group = "Mitsubishi", Number=1210263}, }; var total = data.Sum( (o) => o.Number); double cumSales = 0; foreach(var item in data) { cumSales += item.Number; item.Cumulative = cumSales / total; } return data; } } } |
|