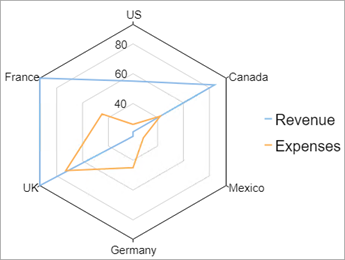
Radar charts are radial charts that help in visualizing comparison of two or more groups of values against various features or characteristics. These charts represent each variable on a separate axis which are arranged radially around a center at equal distances from each other. Each of these axes share the same tick marks and scale.
The data for each observation is plotted along these axis and then joined to form a polygon. Multiple observations, that is, polygons plotted on a chart are also a great way to identify the outliers among each variable. Radar charts are generally used for analyzing performance or comparing values such as revenue and expense as shown in the image below.
The following code demonstrates how you can create a FlexRadar chart:
| Razor |
Copy Code
|
|---|---|
@page "/FlexChart/Radar" @using C1.Chart; @using C1.Blazor.Chart; @using C1.Blazor.Input; <FlexRadar Class="chart" RadarChartType="RadarChartType.Line" Palette="Palette.Standard" LegendStyle="font-size:20px" BindingX="Country" ItemsSource="Data"> <SeriesCollection> <Series Name="Revenue" Binding="Sales" /> <Series Name="Expenses" Binding="Expenses" /> </SeriesCollection> </FlexRadar> @code { List<DataSource.CountryData> Data { get; set; } protected override void OnInitialized() { Data = DataSource.GetData(); } public class DataSource { private static Random rnd = new Random(); public class CountryData { public string Country { get; set; } public double Sales { get; set; } public double Expenses { get; set; } } public static List<CountryData> GetData(int rangeMin = 10, int rangeMax = 100) { var countries = "US,Canada,Mexico,Germany,UK,France".Split(','); var data = new List<CountryData>(); for (int i = 0; i < countries.Length; i++) { var country = new CountryData { Country = countries[i], Sales = rnd.Next(rangeMin, rangeMax), Expenses = rnd.Next(rangeMin, rangeMax) }; data.Add(country); } return data; } } } |
|