In FlexChart, multiple plot areas can be implemented by adding the plot areas to the PlotAreas collection and while defining the series, specify the plot name in which the same has to be rendered. FlexChart also provides properties to set the height, width, row index and column index of each plot area as shown in the image below.
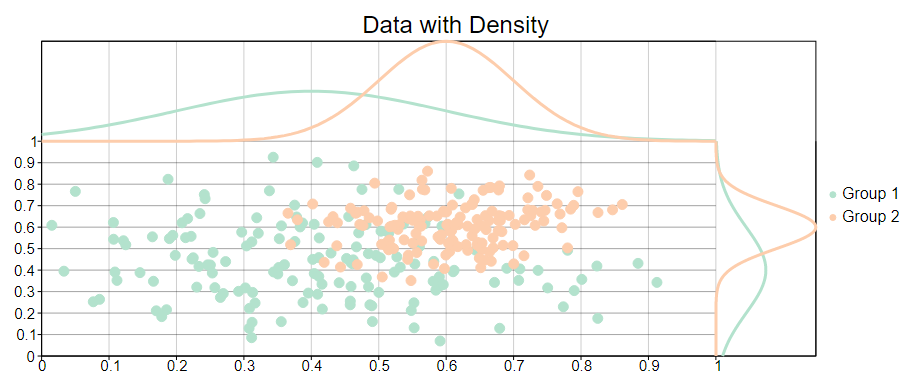
Multiple plot areas are advantageous over multiple overlapped series as they increase the readability of data and hence facilitate better analysis. You can use the below code to implement Multiple plot areas.
| Razor |
Copy Code
|
|---|---|
@using Localization; @using System.Drawing; @using C1.Chart; @using C1.Blazor.Chart; @using C1.Blazor.Input; <FlexChart Class="chart" ChartType="ChartType.Scatter" HeaderContent="Data with Density" HeaderStyle="font-size:24px" LegendPosition="Position.Right" LegendStyle="font-size:16px" PlotStyle="stroke:black" BindingX="X" Binding="Y"> <SeriesCollection> <Series Name="Group 1" ItemsSource="Data1" AxisX="X3" AxisY="Y3" Style="@style1" /> <Series Name="Group 2" ItemsSource="Data2" AxisX="X3" AxisY="Y3" Style="@style2" /> <Series ItemsSource="Density1" ChartType="ChartType.Line" Style="@style1"/> <Series ItemsSource="Density2" ChartType="ChartType.Line" Style="@style2"/> <Series ItemsSource="Density1" BindingX="Y" Binding="X" ChartType="ChartType.Line" AxisX="X2" AxisY="Y2" Style="@style1"/> <Series ItemsSource="Density2" BindingX="Y" Binding="X" ChartType="ChartType.Line" AxisX="X2" AxisY="Y2" Style="@style2"/> </SeriesCollection> <AxisCollection> <Axis AxisType="AxisType.X" Position="Position.Top" Min="0" Max="1" Labels="false" Origin="1" PlotAreaName="PlotArea1" MajorTickMarks="TickMark.None" /> <Axis AxisType="AxisType.Y" Position="Position.Left" Min="0" Labels="false" PlotAreaName="PlotArea1" MajorTickMarks="TickMark.None"/> <Axis AxisType="AxisType.X" Position="Position.Bottom" Name="X2" Labels="false" PlotAreaName="PlotArea2" Min="0" /> <Axis AxisType="AxisType.Y" Position="Position.Right" Name="Y2" Labels="false" PlotAreaName="PlotArea2" Min="0" Max="1" MajorGrid="true" MajorTickMarks="TickMark.None"/> <Axis AxisType="AxisType.X" Position="Position.Bottom" Name="X3" PlotAreaName="PlotArea3" Min="0" Max="1" MajorGrid="true" /> <Axis AxisType="AxisType.Y" Position="Position.Left" Name="Y3" PlotAreaName="PlotArea3" Min="0" Max="1" MajorGrid="true"/> </AxisCollection> <PlotAreaCollection> <PlotArea Name="PlotArea1" Height="100px" /> <PlotArea Name="PlotArea2" Width="100px" Column="1" Row="1" /> <PlotArea Name="PlotArea3" Row="1" /> <PlotArea Name="PlotArea4" Width="100px" Column="1" /> </PlotAreaCollection> </FlexChart> @code { string style1 = "fill:rgba(179,226,205,1);stroke:rgba(179,226,205,1);stroke-width:3"; string style2 = "fill:rgba(253,205,172,1);stroke:rgba(253,205,172,1);stroke-width:3"; List<object> Data1 { get; set; } List<object> Data2 { get; set; } List<PointF> Density1 { get; set; } List<PointF> Density2 { get; set; } protected override void OnInitialized() { Data1 = DataSource.GetData(0.4,0.2); Density1 = DataSource.GetDensity(0, 1, 0.4, 0.2); Data2 = DataSource.GetData(0.6, 0.1); Density2 = DataSource.GetDensity(0, 1, 0.6, 0.1); } public class DataSource { private static Random rnd = new Random(); public static List<object> GetData(double mu, double sigma) { var data = new List<object>(); for (int i = 0; i < 150; i++) { var obj = new { X = rnorm( mu, sigma), Y = rnorm( mu, sigma), }; data.Add(obj); } return data; } static double rnorm(double mu, double sigma) { var u1 = rnd.NextDouble(); var u2 = rnd.NextDouble(); var z0 = Math.Sqrt(-2.0 * Math.Log(u1)) * Math.Cos( 2 * Math.PI * u2); return z0 * sigma + mu; } public static List<PointF> GetDensity(double x1, double x2, double mu, double sigma) { var pts = new List<PointF>(); var dx = 0.01 * (x2 - x1); for (var i = 0; i <= 100; i++) { var x = x1 + i * dx; var y = Math.Exp( -0.5 * (x-mu) * (x-mu) / (sigma * sigma)) / (sigma * Math.Sqrt(2 * Math.PI)); pts.Add(new PointF( (float)x, (float)y)); } return pts; } } } |
|