Trendlines are used to represent trends in data and to examine problems of prediction and are commonly used with price charts or financial charts. Additionally, they can also be used with a variety of technical analysis charts such as MACD (moving average convergence/divergence) which is a trading indicator used in technical analysis of stock prices, or RSI (relative strength index) which is a technical indicator used in the analysis of financial markets. You can add trendlines to your charts to display trends of data. Using this, you can easily analyze the increase or decrease of your Y data over your X data.
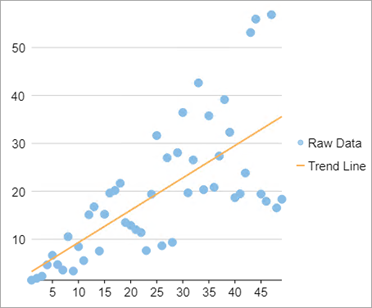
The image below shows how trendline, with FitType set to Linear, appears on the FlexChart.
The following code example demonstrates how to add a trendline to the FlexChart:
| Razor |
Copy Code
|
|---|---|
@page "/FlexChart/TrendLines" @using System.Drawing; @using C1.Chart; @using C1.Blazor.Input; @using C1.Blazor.Chart; <FlexChart Class="chart" ChartType="ChartType.Scatter" BindingX="X" Binding="Y" Tooltip="X={x:n1},Y={y:n1}"> <SeriesCollection> <Series Name="Cost" ItemsSource="Data" /> <TrendLine Name="Trend Line" FitType="FitType.Linear" Order="order" ItemsSource="Data" /> </SeriesCollection> </FlexChart> @code { List<PointF> Data { get; set; } int order = 3; int[] orders = new int[] { 2, 3, 4, 5, 6 }; protected override void OnInitialized() { Data = DataSource.GetData(50); } public class DataSource { static Random rand = new Random(); public static List<PointF> GetData(int cnt) { var data = new List<PointF>(); var a = rand.NextDouble(); var b = rand.NextDouble(); for (var i = 1; i < cnt; i++) data.Add(new PointF(i, (float)(a + i * b + i * rand.Next(10, 40)))); return data; } } } |
|