Annotations are used to mark important news or events that can be attached to a specific data point on FinancialChart. Users can hover over the event to display the full annotation text. FinancialChart's Annotation lets a user add different types of annotations on the chart, including text, shapes, images. There are various built-in shapes which are supported as annotations in FlexChart, such as Circle, Ellipse, Image, Line, Polygon, Rectangle, Square and Text.
You can specify the position of annotation on FlexChart by setting the AnnotationPosition property to Bottom, Center, Left, Right or Top. To specify the attachment of annotation in FlexChart, you can use the AnnotationAttachment property, and set its value to:
This section describes how to add annotations to a FlexChart control in an MVC web application.
This topic comprises of three steps:
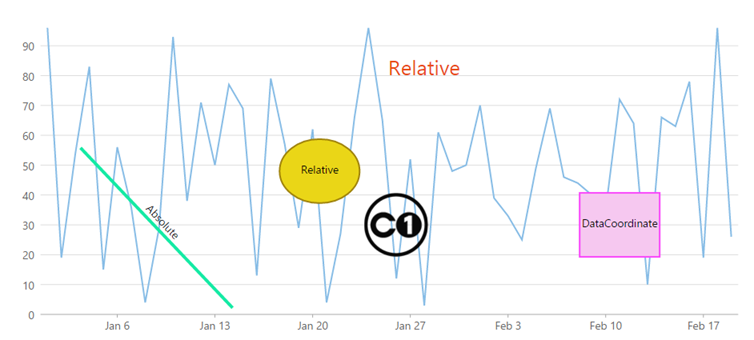
The following image shows how FlexChart appears after completing the steps above:
Sale.cs). See Adding controls to know how to add a new model.| C# |
Copy Code
|
|---|---|
public class Sale { public int ID { get; set; } public DateTime Start { get; set; } public DateTime End { get; set; } public string Country { get; set; } public string Product { get; set; } public string Color { get; set; } public double Amount { get; set; } public double Amount2 { get; set; } public double Discount { get; set; } public bool Active { get; set; } public MonthData[] Trends { get; set; } public int Rank { get; set; } private static List<string> COUNTRIES = new List<string> { "US", "UK", "Canada", "Japan", "China", "France", "German", "Italy", "Korea", "Australia" }; private static List<string> PRODUCTS = new List<string> { "Widget", "Gadget", "Doohickey" }; /// <summary> /// Get the data. /// </summary> /// <param name="total"></param> /// <returns></returns> public static IEnumerable<Sale> GetData(int total) { var colors = new[] { "Black", "White", "Red", "Green", "Blue" }; var rand = new Random(0); var dt = DateTime.Now; var list = Enumerable.Range(0, total).Select(i => { var country = COUNTRIES[rand.Next(0, COUNTRIES.Count - 1)]; var product = PRODUCTS[rand.Next(0, PRODUCTS.Count - 1)]; var color = colors[rand.Next(0, colors.Length - 1)]; var startDate = new DateTime(dt.Year, i % 12 + 1, 25); var endDate = new DateTime(dt.Year, i % 12 + 1, 25, i % 24, i % 60, i % 60); return new Sale { ID = i + 1, Start = startDate, End = endDate, Country = country, Product = product, Color = color, Amount = Math.Round(rand.NextDouble() * 10000 - 5000, 2), Amount2 = Math.Round(rand.NextDouble() * 10000 - 5000, 2), Discount = Math.Round(rand.NextDouble() / 4, 2), Active = (i % 4 == 0), Trends = Enumerable.Range(0, 12).Select(x => new MonthData { Month = x + 1, Data = rand.Next(0, 100) }).ToArray(), Rank = rand.Next(1, 6) }; }); return list; } public static List<string> GetCountries() { var countries = new List<string>(); countries.AddRange(COUNTRIES); return countries; } public static List<string> GetProducts() { List<string> products = new List<string>(); products.AddRange(PRODUCTS); return products; } } public class BasicSale { public int Sale { get; set; } public DateTime Date { get; set; } public BasicSale(int sale, DateTime date) { Sale = sale; Date = date; } public static List<BasicSale> GetBasicSales() { List<BasicSale> list = new List<BasicSale>(); int[] sales = { 96, 19, 54, 83, 15, 56, 36, 4, 29, 93, 38, 71, 50, 77, 69, 13, 79, 57, 29, 62, 4, 27, 66, 96, 65, 12, 52, 3, 61, 48, 50, 70, 39, 33, 25, 49, 69, 46, 44, 40, 35, 72, 64, 10, 66, 63, 78, 19, 96, 26}; for (int i = 0; i < sales.Length; i++) { list.Add(new BasicSale(sales[i], new DateTime(2014, i / 31 + 1, i % 31 + 1))); } return list; } } |
|
Complete the following steps to initialize a FlexChart control and add annotations to it.
Add a new Controller
AnnotationController).Index() with the following method.
| C# |
Copy Code
|
|---|---|
public ActionResult Index() { return View(BasicSale.GetBasicSales()); } |
|
Add a View for the Controller
AnnotationController to open it.Index().| HTML |
Copy Code
|
|---|---|
//TagHelperExplorer is the name of the MVC application. @using TagHelperExplorer.Models @using C1.Web.Mvc @using C1.Web.Mvc.Chart @model IEnumerable<BasicSale> @{ var lineTooltip = "This is line annotation. </br> start: { x: 50, y: 150 } end: { x: 240, y: 350 } </br> attachment: Absolute"; var textTooltip = "This is text annotation.</br> point: { x: 0.55, y: 0.15 }</br> attachment: Relative"; var ellipseTooltip = "This is ellipse annotation.</br> point: { x: 0.4, y: 0.5 }</br> attachment: Relative"; var rectTooltip = "This is rectangle annotation.</br> point:{ x: new DateTime(2014, 2, 11), y: 30 }</br> attachment: DataCoordinate"; var imageTooltip = "This is image annotation.</br> point:{x: new DateTime(2014, 1, 26), y: 30}</br> attachment: DataCoordinate"; var lineStyle = new SVGStyle { Stroke = "#17EAA5", StrokeWidth = 4 }; var textStyle = new SVGStyle { Fill = "#EA4C17", FontSize = 26 }; var ellipseStyle = new SVGStyle { Fill = "#EAD617", Stroke = "#A1840D" }; var rectStyle = new SVGStyle { Fill = "#F6C8F0", Stroke = "#F947FB" }; } <c1-flex-chart binding-x="Date"> <c1-items-source source-collection="Model"></c1-items-source> <c1-flex-chart-series binding="Sale" chart-type="ChartType.Line"> </c1-flex-chart-series> <c1-annotation-layer> <c1-annotation-line start="new DataPoint(50,150)" end="new DataPoint(240, 350)" tooltip="@lineTooltip" style="lineStyle" content="Absolute"> </c1-annotation-line> <c1-annotation-text attachment="AnnotationAttachment.Relative" point="new DataPoint(0.55,0.15)" content="Relative" tooltip="@textTooltip" style="textStyle"> </c1-annotation-text> <c1-annotation-ellipse attachment="AnnotationAttachment.Relative" width="100" height="80" content="Relative" point="new DataPoint(0.4,0.5)" tooltip="@ellipseTooltip" style="ellipseStyle"> </c1-annotation-ellipse> <c1-annotation-rectangle attachment="AnnotationAttachment.DataCoordinate" point="new DataPoint(new DateTime(2014, 2, 11), 30)" content="DataCoordinate" tooltip="@rectTooltip" style="rectStyle"> </c1-annotation-rectangle> <c1-annotation-image attachment="AnnotationAttachment.DataCoordinate" href="/Content/images/c1icon.png" point="new DataPoint(new DateTime(2014, 1, 26), 30)" width="80" height="80" tooltip="@imageTooltip"> </c1-annotation-image> </c1-annotation-layer> </c1-flex-chart> |
|