Break-even chart series is a graphical representation between cost, sales volume and profits. It shows the sales volume level at which total costs equal sales and helps in making profit planning. You can use this chart in the scenarios where you want to determine at what point your company, or a new product or service, will be profitable or say, the number of products/services your company needs to sell to at least cover your costs.
In FlexChart, the BreakEven class represents the Break-Even chart series. This series can be added to FlexChart controls using the AddBreakEven method to show the evolution of profits over time, and how long it takes to reach the break-even point where revenues surpass expenses.
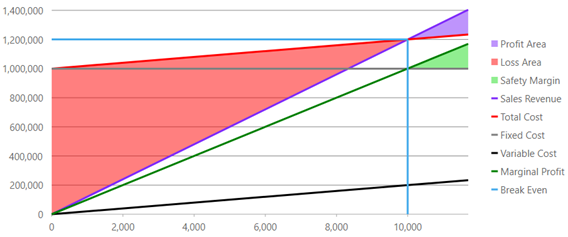
The following example shows how you can create a BreakEven chart using the FlexChart control. In the example, based on the given data, the break-even point is 10,000 units sold. At this point, sales revenue and total cost, both are at 1,200,000 and cancel each other out. Also, the profit area is beyond this point.
| BreakEvenController |
Copy Code
|
|---|---|
public ActionResult Index() { return View(); } |
|
| Index.cshtml |
Copy Code
|
|---|---|
@using C1.Web.Mvc

@{
    var style = new SVGStyle { Fill = "rgba(127,42,250,0.5)", StrokeWidth = 0 };
    var altStyle = new SVGStyle { Fill = "rgba(255,0,0,0.5)", StrokeWidth = 0 };
    var breakEvenStyles = new BreakEvenStyles();
    breakEvenStyles.SafetyMargin = new SVGStyle { Fill = "lightgreen", StrokeWidth = 0 };
    breakEvenStyles.SalesRevenue = new SVGStyle { Stroke = "rgba(127,42,250,1)", StrokeWidth = 3 };
    breakEvenStyles.FixedCost = new SVGStyle { Stroke = "grey", StrokeWidth = 3 };
    breakEvenStyles.TotalCost = new SVGStyle { Stroke = "red", StrokeWidth = 3 };
    breakEvenStyles.VariableCost = new SVGStyle { Stroke = "black", StrokeWidth = 3 };
    breakEvenStyles.MarginalProfit = new SVGStyle { Stroke = "green", StrokeWidth = 3 };
    breakEvenStyles.BreakEven = new SVGStyle { Stroke = "rgba(69,171,235,1)", StrokeWidth = 3 };
}

<c1-flex-chart>
    <c1-flex-chart-breakeven fixed-cost="1000000" variable-cost="20" sales-price="120"
                             style="style" alt-style="altStyle" styles="breakEvenStyles">
    </c1-flex-chart-breakeven>
</c1-flex-chart>
|
|