You can add multiple series to your charts and set a different ChartType for all the series. Such charts are helpful in analyzing complex chart data on a single canvas. The same data can be used with different visualizations or related data can be displayed together to convey trends.
The following image shows a FlexChart with multiple series.
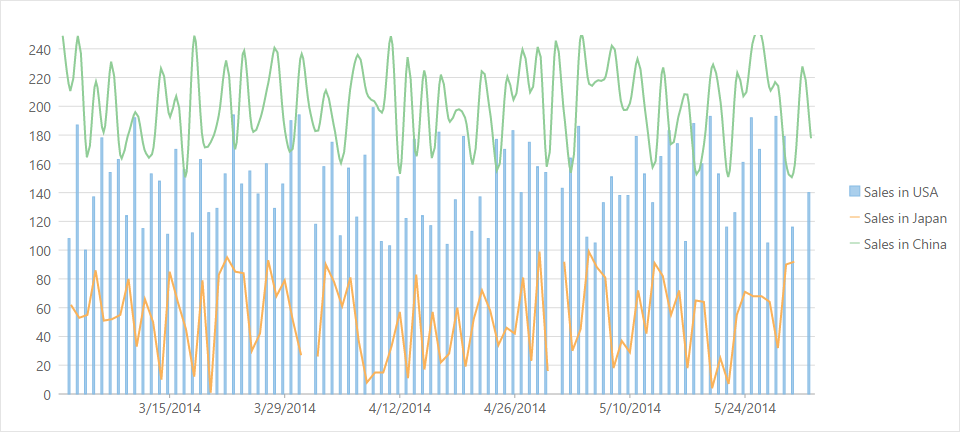
The following code example demonstrates how to add multiple chart series with different ChartTypes to the FlexChart.
| HTML |
Copy Code
|
|---|---|
<c1-flex-chart binding-x="Name" chart-type="ChartType.Column" > <c1-items-source source-collection="Model"></c1-items-source> <c1-flex-chart-series binding="SalesInUSA" name="Sales in USA" chart-type="ChartType.Column"> </c1-flex-chart-series> <c1-flex-chart-series binding="SalesInJapan" name="Sales in Japan" chart-type="ChartType.Line"> </c1-flex-chart-series> <c1-flex-chart-series binding="SalesInChina" name="Sales in China" chart-type="ChartType.Spline"> </c1-flex-chart-series> </c1-flex-chart> |
|