There might be a scenario where you want to visualize and compare data of a category across different groups. This can be achieved plotting multiple pie charts together. In the following example, we are comparing the downloads and sales of a product in different countries using multiple pie charts.
FlexPie allows user to create multiple pie charts, based on the same data source, by simply specifying several comma-separated strings of field names in Binding property of the FlexPie class.
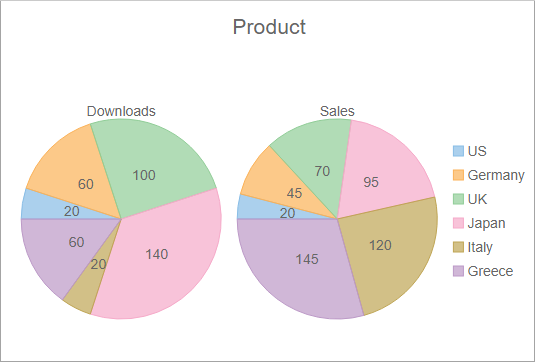
The following image shows two pie charts, namely Downloads and Sales, for six different countries.
The following code demonstrates how to add multiple pie charts using the same data source. This code uses data from the ProductSales class, available with the MvcExplorer sample.
Controller code
| MultipleChartsController.cs |
Copy Code
|
|---|---|
public ActionResult Index() { return View(ProductSales.GetData()); } |
|
View code
| MultipleCharts.cshtml |
Copy Code
|
|---|---|
@using C1.Web.Mvc.Grid @using Core_FlexPieMultiplePieChart.Models @model IEnumerable<ProductSales> <c1-flex-pie id="multipleChart" header="Product" binding-name="Country" binding="Downloads,Sales"> <c1-items-source source-collection="Model"></c1-items-source> <c1-flex-pie-datalabel content="{value}"></c1-flex-pie-datalabel> </c1-flex-pie> |
|