FinancialChart's MovingAverage represents a moving average trendline for a financial chart. It is a calculation to analyze data points by creating a series of averages of different subsets of the full data set. You may define a different type on each MovingAverage object by setting the MovingAverageType property to:
In this example, MovingAverageType property value is set as Exponential.
Use the Period property of the MovingAverage class to set the number of periods for computing the average value. Its value should be set to integer value greater than 1. In this example, the value of Period property is assigned an integer value 5.
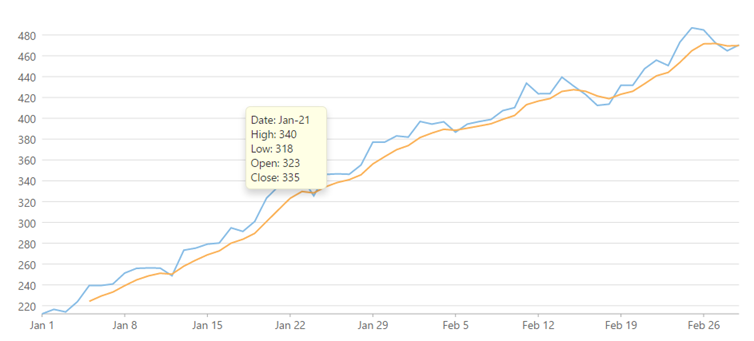
The image below shows how FinancialChart appears when the MovingAverage is used to calculate and display average on the chart, the MovingAverageType value is set to Exponential and the value of Period property to 5.
The following code example demonstrates how to use MovingAverage to analyze data on FinancialChart. This example uses the sample created in the Quick Start section.
| Razor |
Copy Code
|
|---|---|
@using MVCFinancialChart.Models @model List<FinanceData> <script type="text/javascript"> var tooltipContent = function (ht) { var item = ht.series.collectionView.items[ht.pointIndex]; if (item) { return 'Date: ' + wijmo.Globalize.format(ht.x, 'MMM-dd') + '<br/>' + 'High: ' + item.High.toFixed() + '<br/>' + 'Low: ' + item.Low.toFixed() + '<br/>' + 'Open: ' + item.Open.toFixed() + '<br/>' + 'Close: ' + item.Close.toFixed() + '<br/>' } }; </script> @(Html.C1().FinancialChart() .Bind(Model) .BindingX("X") .ChartType(C1.Web.Mvc.Chart.Finance.ChartType.Line) .Series(sers => { sers.Add().Binding("Close"); sers.AddMovingAverage().Binding("Close").Period(5).Type(C1.Web.Mvc.Chart.MovingAverageType.Exponential); }) .Tooltip(t => t.Content("tooltipContent"))) |
|