FlexChart and FinancialChart let a user create analytical charts with function series using different formulae. You can add Y function series or Parametric function series using AddYFunctionSeries and AddParametricFunctionSeries. YFunctionSeries calculates y by a given function, and PfunctionSeries calculates X and Y by given x and y functions. Users can plot any type of curve basis the values and formula. In these examples, different formulae are used that compute the sine and cos values, and return a value to be displayed on the chart.
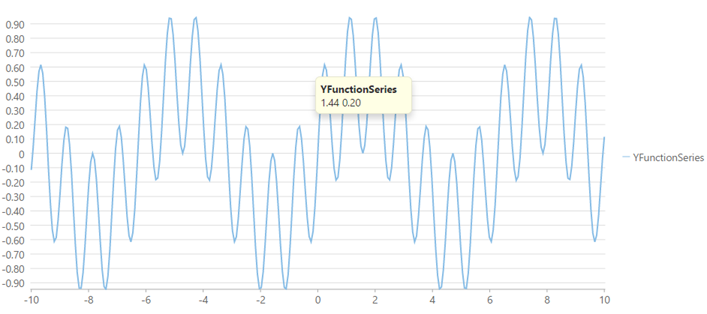
The image below shows how FlexChart appears with Y function series.
The following code example demonstrates how to use Y function series to analyze data on FinancialChart. This example uses the sample created in the Quick Start section.
| Razor |
Copy Code
|
|---|---|
@using C1.Web.Mvc.Chart

<div>
    <div>
        <script type="text/javascript">
            function yFunc(value) {
                return Math.sin(4 * value) * Math.cos(3 * value);
            }
        </script>
        @(Html.C1().FlexChart().Legend(Position.Right)
            .Series(ses =>
            {
                ses.AddYFunctionSeries("YFunctionSeries").Min(-10).Max(10).SampleCount(300).Func("yFunc");
            }))
    </div>
</div>
|
|
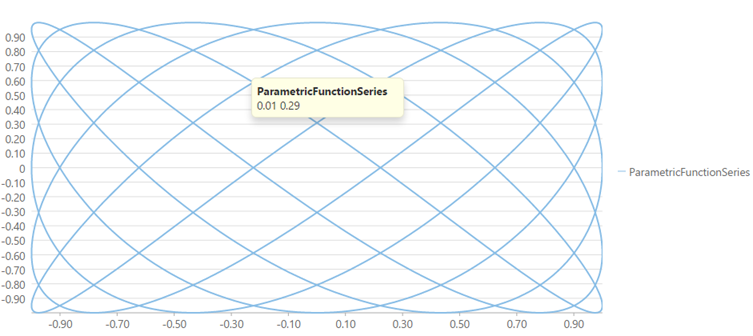
The following code example demonstrates how to use parametric function series to analyze data on FinancialChart. This example uses the sample created in the Quick Start section.
| Razor |
Copy Code
|
|---|---|
@using C1.Web.Mvc.Chart

<div>
    <div>
        <script type="text/javascript">
            var xParam = 5, yParam = 7;
            function xFunc(value) {
                return Math.cos(value * xParam);
            }
            function yFunc(value) {
                return Math.sin(value * yParam);
            }
        </script>
        @(Html.C1().FlexChart().Legend(Position.Right)
            .Series(ses =>
            {
                ses.AddParametricFunctionSeries("ParametricFunctionSeries")
                    .Max(2 * Math.PI)
                    .SampleCount(1000)
                    .XFunc("xFunc")
                    .YFunc("yFunc");
            }))
    </div>
</div>
|
|