When it comes do presenting data using map, you need to make sure to choose the appropriate map type for your data. This determines how effectively the data is depicted when visualized using a map. FlexMap supports point and choropleth maps. Point maps display data points at bound coordinates on the map and can be used to create scatter maps and bubble maps. On the other hand, Choropleth maps are used to show statistical values for geographic areas. Let us discuss about these map types in detail in the following sections.
FlexMap supports point maps, which creates scatter maps easily. The Scatter map shows points of interest at specific geographical coordinates on a map. It can be created in FlexMap using the Scatter Map layer. For detailed information on how FlexMap can be used to create scatter map, see ScatterMap Layer.
Choropleth map is one of the most common color-encoded map visualization which is used to show statistical values for geographic areas. With FlexMap, you can easily create a choropleth map as shown in the image below.
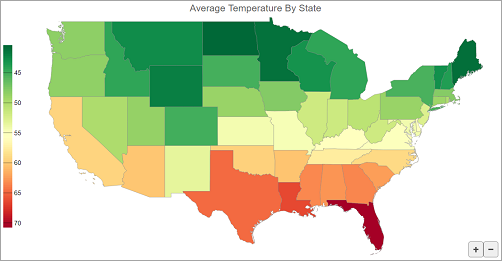
In the following example, we created a choropleth map and colored the map according to the data values contained in the GeoJSon data from the "temp.json" file (available in the FlexMap product sample at Documents\ComponentOne Samples\ASP.NET MVC location on your system). In this choropleth map, each state is colored according to its average yearly temperature.
| Index.html |
Copy Code
|
|---|---|
    <script>
        c1.documentReady(function () {
            window.dataMap = new Map();
            wijmo.httpRequest('/Content/data/temp.json', {
                success: xhr => {
                    JSON.parse(xhr.responseText).forEach(el => dataMap.set(el.State, parseFloat(el.AverageTemperature)));
                }
            });
        });

        function geoMapItemsSourceChanged(layer, a) {
            var map = wijmo.Control.getControl("#flexMap");
            map.zoomTo(layer.getGeoBBox());
        }

        function colorScale(v) {
            return 1 - v;
        }

        function colorScaleBinding(o) {
            return dataMap.get(o.properties.name)
        }

        function tooltipPopup(tt, e) {
            if (!wijmo.isFunction(tt.content)) {
                tt.content = function (f) {
                    return f.name + ' ' + dataMap.get(f.name) + '°F';
                }
                e.cancel = true;
            }
        }
    </script>


@(Html.C1().FlexMap().Id("flexMap")
        .Header("Average Temperature By State")
        .Height(600)
        .Tooltip(tt => tt.Content("<b>{name}</b>").OnClientPopup("tooltipPopup"))
        .Legend(lg => lg.Position(C1.Web.Mvc.Chart.Position.Left))
        .Layers(ls =>
        {
            ls.AddGeoMapLayer()
                .Url("/Content/data/US.json")
                .ColorScale(cs => cs.Scale("colorScale")
                                  .Binding("colorScaleBinding")
                                  .Colors(C1.Web.Mvc.Chart.Palettes.Diverging.RdYlGn))
                .OnClientItemsSourceChanged("geoMapItemsSourceChanged");

        })
)
|
|