Consume Web API to create a chart in Excel
In This Topic
In this topic, you learn how to import data from a Web API into Excel and create a chart using the imported data. The steps below will guide you ahead:
- Open MS Excel and create a new Workbook.
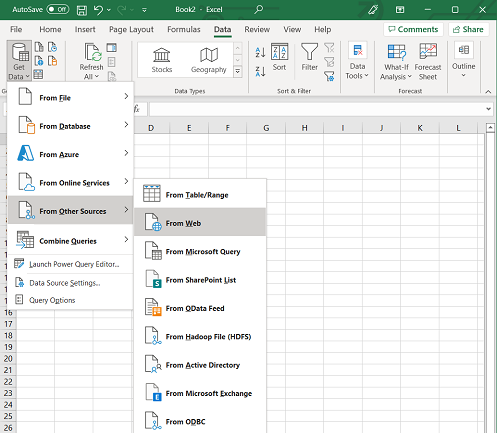
- Switch to Data tab and choose Get Data>From other Sources> From Web.
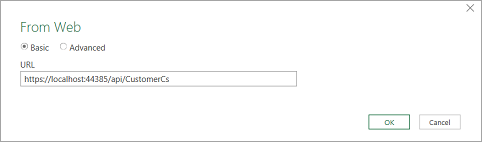
- In the From Web prompt window that appears, paste the API URL (The URL generated on executing the Salesforce WebAPI project).
- On the result window prompt which appears, choose Transform >To Table on the menu and then click OK.
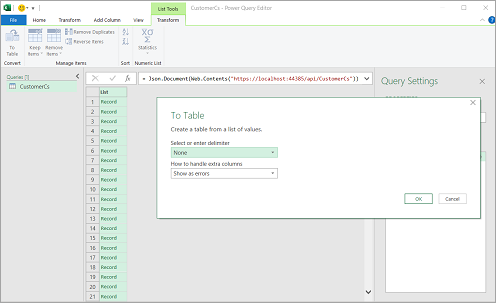
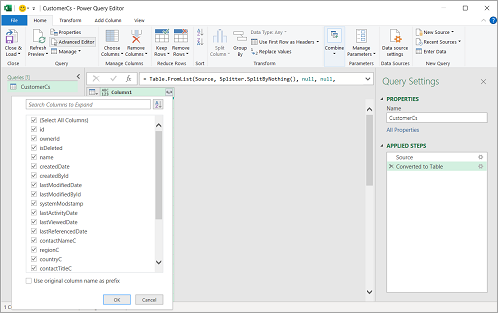
- Click on the button with left and right arrow in the column header cell(having text Column1), and uncheck Use Original name as prefix in the dialog, then click OK. Finally, click Close & Load on the Home menu.
This displays the JSON data imported from a WebAPI loaded into a new worksheet, as depicted in the screenshot below:
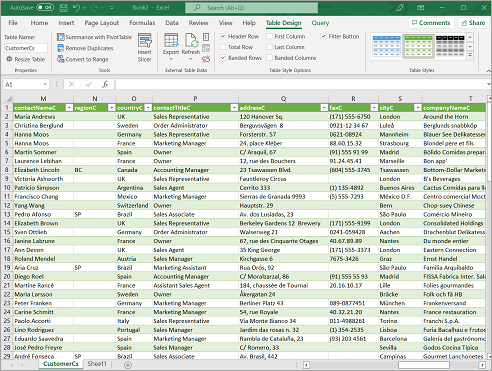
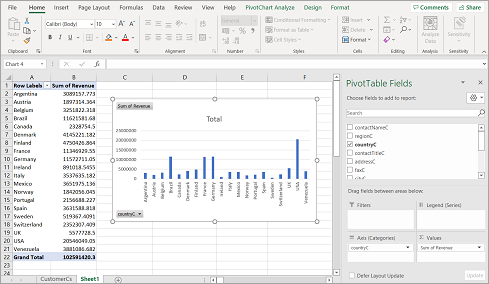
After importing the data, it is just like any random sheet of data added to an Excel Workbook. You can use it to create Pivot Views or Charts.
As an example, we created both. Since, the data is too huge, so we created a PivotView and using the aggregated data from the Pivot, we inserted a chart as depicted in the image below: