You can use grids and charts to visualize queries results in the DataEngine Workbench. The application enables users to customize the Base Table and Query data using the Base Table and Query data tiles. It allows users to visualize Base Table or Query result sets with a variety of chart components. Further, users also get an option to remove undesired base table or query result sets from existing C1DataEngine workspaces.
The user can move the cursor over the tile to see buttons located on the top right corner of the Base Table data tile.
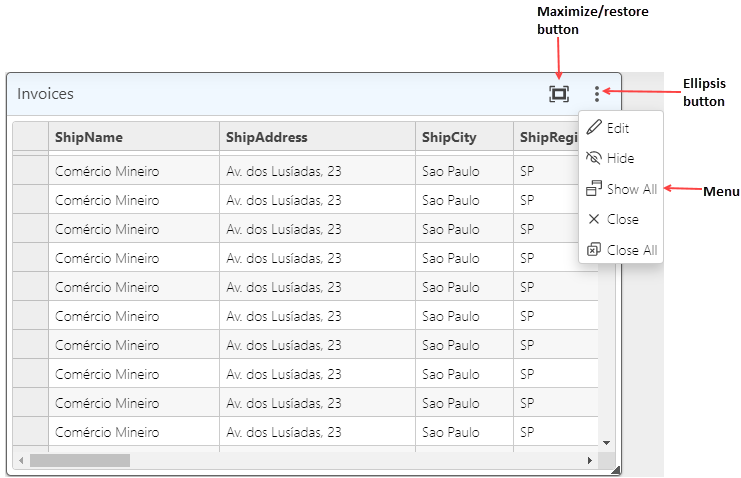
The functions of these buttons are explained below:
Maximize (or restore) button: Click the maximise/restore button to maximize and return the Base Table data tile to its original size.
Vertical ellipsis button: Click the vertical ellipsis button to open a menu of Edit, Hide, Show All, Close and Close All buttons.
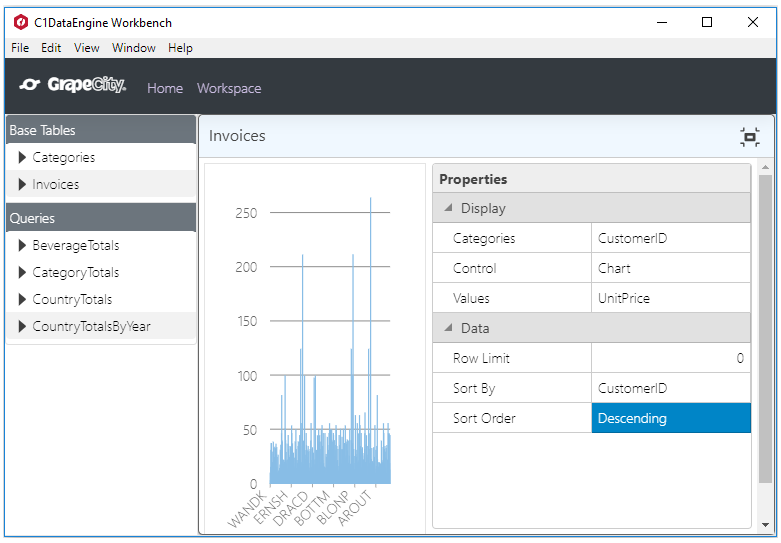
The Edit button allows the user to customize the properties of the Base Table data. Clicking the Edit button adds a Properties panel to the right of the BaseTable data. Here, the user can edit the Display and Data properties. You can customize the Categories and Values, and switch between different display Control options such as grid, chart, pie, sunburst and tree map. You can also set Row Limits and Sort Order.
The image visualizes Base Table result set in Edit mode using the Chart control.
When you are done editing, click the restore icon on the right side of the tile header. Your layout changes will be automatically saved to a file in the workspace folder you selected previously.
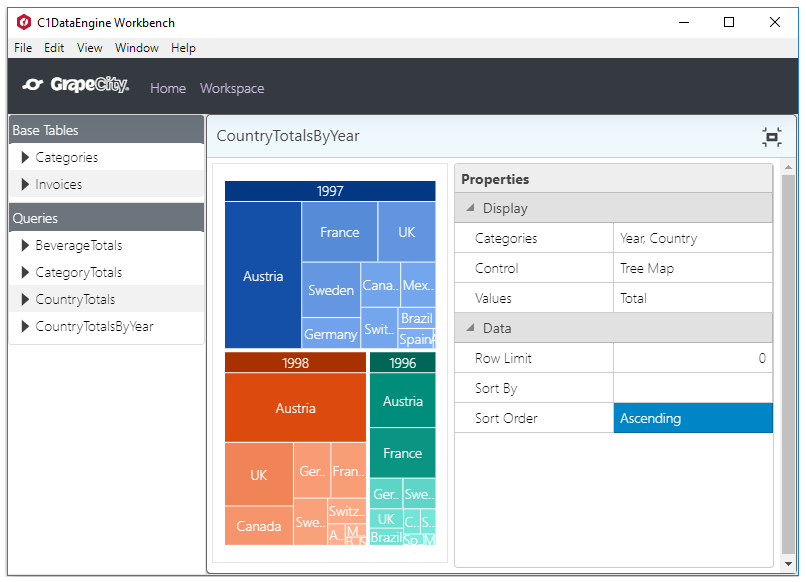
The user can also customize the Query data tile in the same manner as the Base Table data.
The image depicts Query result set in Edit mode using the Tree Map control.