ComponentOne FinancialChart for UWP
Interaction / Range Selector
In This Topic
    Range Selector
    In This Topic

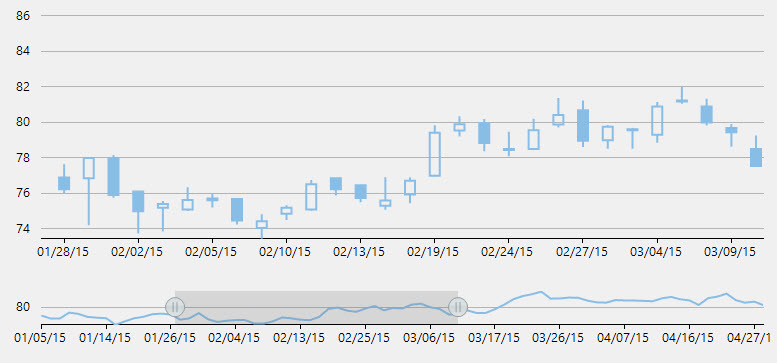
    FinancialChart's RangeSelector lets a user select a specific range of data to be displayed on the chart. A user can easily bind the RangeSelector with various types of financial charts. It is mostly used by finance industry to perform stock analysis on different data ranges.

    The RangeSelector has a left thumb (for minimum value) and right thumb (for maximum value) that lets you scroll through particular time periods on the chart. Users can change the minimum and maximum values of the RangeSelector, and adjust the visible range of data on the chart by dragging these thumbs to left or right. On dragging the thumb towards left on the range bar, you reduce its value, and dragging it towards the right increases its value on the range bar.

    To set the minimum and maximum range in code, use the Min and Max properties of the RangeSelector.

    The following code snippet shows how you can use RangeSelector to create your applications.

    public class DataService
    {
        List<Company> _companies = new List<Company>();
        Dictionary<string, List<Quote>> _cache = new Dictionary<string, List<Quote>>();
    
        private DataService()
        {
            _companies.Add(new Company() { Symbol = "box", Name = "Box Inc" });
            _companies.Add(new Company() { Symbol = "fb", Name = "Facebook" });
        }
    
        public List<Company> GetCompanies()
        {
            return _companies;
        }
    
        public List<Quote> GetSymbolData(string symbol)
        {
            if (!_cache.Keys.Contains(symbol))
            {
                string path = string.Format("FinancialChartExplorer.Resources.{0}.json", symbol);
                Assembly asm = this.GetType().GetTypeInfo().Assembly;
                var stream = asm.GetManifestResourceStream(path);
                var ser = new DataContractJsonSerializer(typeof(Quote[]));
                var data = (Quote[])ser.ReadObject(stream);
                var dataList = data.ToList();
                if (IsWindowsPhoneDevice())
                {
                    dataList = dataList.Take(20).ToList();
                }
                _cache.Add(symbol, dataList);
            }
    
            return _cache[symbol];
        }
    
        bool IsWindowsPhoneDevice()
        {
            if (Windows.Foundation.Metadata.ApiInformation.IsTypePresent("Windows.Phone.UI.Input.HardwareButtons"))
            {
                return true;
            }
            return false;
        }
    
        static DataService _ds;
        public static DataService GetService()
        {
            if (_ds == null)
                _ds = new DataService();
            return _ds;
        }
    }
    
    public class Quote
    {
        public string date { get; set; }
        public double high { get; set; }
        public double low { get; set; }
        public double open { get; set; }
        public double close { get; set; }
        public double volume { get; set; }
    }
    
    public class Company
    {
        public string Symbol { get; set; }
        public string Name { get; set; }
    }
    
    <Grid Background="{ThemeResource ApplicationPageBackgroundThemeBrush}">
        <Grid.RowDefinitions>
            <RowDefinition />
            <RowDefinition x:Name="row" Height="100" />
        </Grid.RowDefinitions>
        <Chart:C1FinancialChart x:Name="candlestickChart"
                                BindingX="date"
                                Binding="high,low,open,close,volume"
                                ChartType="Candlestick"
                                ItemsSource="{Binding Data}">
            <Chart:FinancialSeries />
        </Chart:C1FinancialChart>
        <Chart:C1FinancialChart x:Name="financialChart"
                                BindingX="date"
                                Binding="close"
                                ChartType="Line"
                                ToolTip="{x:Null}"
                                Grid.Row="1" 
                                ItemsSource="{Binding Data}">
            <Chart:FinancialSeries />
        </Chart:C1FinancialChart>
        <Extension:RangeSelector x:Name="rangeSelector"
                                 Grid.Row="1"
                                 ParentChart="{Binding ElementName=financialChart}"
                                 ValueChanged="OnRangeSelectorValueChanged"
                                 Margin="20 10 0 10" />
    </Grid>
    
    Visual Basic
    Copy Code
    Partial Public Class RangeSelector
        Inherits Page
        Private dataService As DataService = dataService.GetService()
    
        Public Sub New()
            InitializeComponent()
        End Sub
    
        Public ReadOnly Property Data() As List(Of Quote)
            Get
                Return dataService.GetSymbolData("fb")
            End Get
        End Property
    
        Sub OnRangeSelectorValueChanged(sender As Object, e As EventArgs)
            candlestickChart.AxisX.Min = rangeSelector.LowerValue
            candlestickChart.AxisX.Max = rangeSelector.UpperValue
        End Sub
    End Class
    

    C#
    Copy Code
    public partial class RangeSelector : Page
    {
        DataService dataService = DataService.GetService();
    
        public RangeSelector()
        {
            InitializeComponent();
        }
    
        public List<Quote> Data
        {
            get
            {
                return dataService.GetSymbolData("fb");
            }
        }
    
        void OnRangeSelectorValueChanged(object sender, EventArgs e)
        {
            candlestickChart.AxisX.Min = rangeSelector.LowerValue;
            candlestickChart.AxisX.Max = rangeSelector.UpperValue;
        }
    }