The Area Chart depicts change in data over a period of time. It represents data series by connecting data points against Y-axis and filling the area between the series and X-axis. In addition, the chart displays data series in the same order in which they are added—back-to-front.
To create the Area Chart, you need to set the ChartType property to Area.
You can set the Stacking property to Stacked or Stacked100pc to create the stacking Area Chart.
The following chart displays the Area chart:
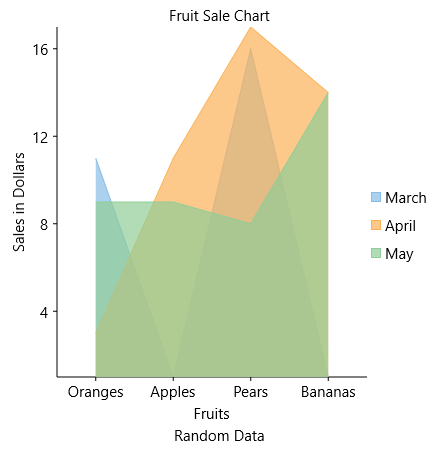
The above chart represents the rise of a stock by plotting the stock values in three months. The three areas for three different stocks have been rendered using three different colors.