In a chart, there are two primary axes: X and Y. There are of course exceptions when you work with pie charts.
In FlexChart, X-axis and Y-axis are represented by the AxisX and the AxisY property respectively. Both these properties can be customized using the properties provided by the Axis class.
| Property | Description |
|---|---|
| AxisLine | Determines whether the axis line is visible. |
| Position | Sets the position of the axis. |
| Reversed | Reverses the direction of the axis. |
| Style | Contains properties that set the style of the axis. |
| Title | Sets the title text to display next to the axis. |
| Property | Description |
|---|---|
| Format | Sets the format string for the axis labels. |
| LabelAlignment | Sets the alignment of the axis labels. |
| LabelAngle | Set the rotation angle of the axis labels. |
| Labels | Determines whether the axis labels are visible. |
| MajorUnit | Sets the number of units between axis labels. |
| Property | Description |
|---|---|
| GroupNames | Sets the group name for the axis labels. |
| GroupItemsPath | Sets the group name for the axis labels in hierarchical data. |
| GroupSeparator | Set the axis group separator. |
| GroupProvider | Sets the axis group provider. |
| Property | Description |
|---|---|
| MajorGrid | Determines whether the axis includes gridlines. |
| MajorGridStyle | Contains properties to control the appearance of the grid lines drawn perpendicular to the major tickmarks. |
| MajorTickMarks | Sets the location of the axis tickmarks. |
| Max | Sets the maximum value for the axis. |
| Min | Sets the minimum value for the axis. |
| Origin | Sets the value at which an axis crosses the perpendicular axis. |
| OverlappingLabels | Manages the overlapping labels in the chart for any reason. |
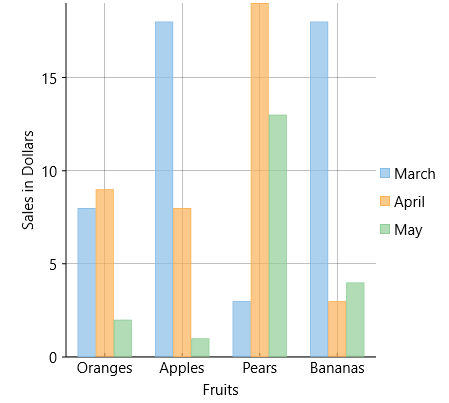
Here is the Xaml for setting Axes (Axis X and Axis Y properties) for the chart:
| XAML |
Copy Code
|
|---|---|
<Chart:C1FlexChart.AxisX> <Chart:Axis MajorGrid="True" Position="Bottom" Title="Fruits" MajorTickMarks="Inside"></Chart:Axis> </Chart:C1FlexChart.AxisX> <Chart:C1FlexChart.AxisY> <Chart:Axis Position="Left" MajorUnit="5" Title="Sales in Dollars" MajorGrid="True"/> </Chart:C1FlexChart.AxisY> |
|
For more details on Axes, refer to FlexChart Axes.