In This Topic
The Candlestick Chart integrates Bar and Line charts to depict a range of values over time. It consists of visual elements known as candles that are further comprised of three elements: body, wick, and tail.
- The body represents the opening and the closing value, while the wick and the tail represent the highest and the lowest value respectively.
- A hollow body indicates a rising stock price (the closing value is greater than the opening value).
- A filled body indicates a falling stock price (the opening value is greater than the closing value).
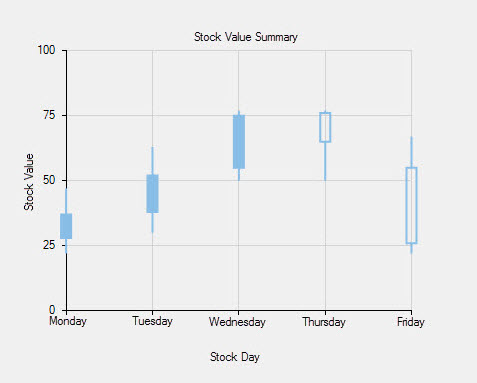
The Candlestick Chart is appropriate to represent the stock value summary.