Series are the groupings of the related points of data inside the Plot Area of the chart. You can set different chart types for different series of data.
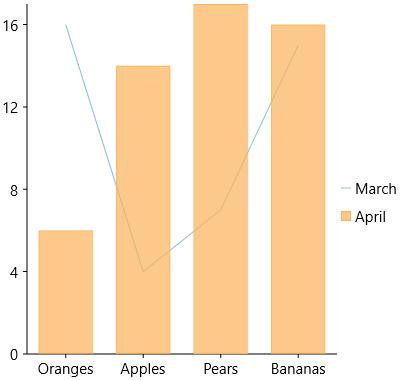
The following image illustrates data series in FlexChart:
Data series in FlexChart are controlled by the Series object that comprises the following properties:
| Property | Description |
|---|---|
| AxisX | Sets the series X-axis. |
| AxisY | Sets the series Y-axis. |
| Binding | Sets the name of the property that contains Y values for the series. |
| BindingX | Sets the name of the property that contains X values for the series. |
| ChartType | Sets the series chart type. |
| ItemSource | Sets the collection of objects containing the series data. |
| SeriesName | Sets the series text that is displayed in the legend. |
| Style | Sets the style of the series. |
| SymbolMarker | Sets the shape of the marker to be used for each data point of the series. This property applies to Scatter, LineSymbols, and SplineSymbols chart types only. |
| SymbolSize | Sets the size of the symbols used to render the series. |
| SymbolStyle | Sets the style of the symbols used in the series. |
| Visibility | Determines whether the series is visible and sets the position of the series, if it's visible. |
Here is the Xaml for customizing the setting the properties for chart series:
| Example Title |
Copy Code
|
|---|---|
<Chart:C1FlexChart.Series>
                <Chart:Series SeriesName="March" Binding="March" ChartType="Line"/>
                <Chart:Series SeriesName="April" Binding="April"/>
                </Chart:C1FlexChart.Series>
|
|
You can also set the properties for chart series from the Series Collection Editor in the Properties window.
For more information on Series, refer to FlexChart Series.