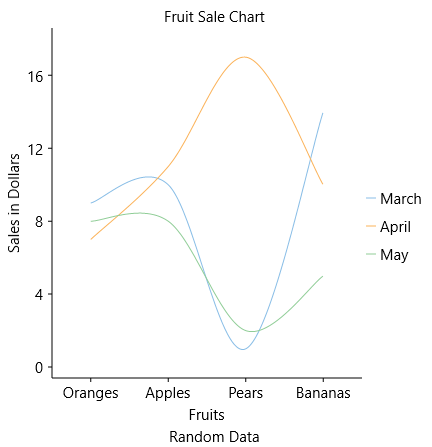
The Spline Chart is similar to the line chart except that it connects data points by using splines rather than straight lines. The chart is used as an alternative to the line chart, but more specifically for representing data that requires the use of curve fittings.
You need to set the ChartType property to Spline to create the Spline Chart.
You can set the Stacking property to Stacked or Stacked100pc to create the stacking Spline Chart.