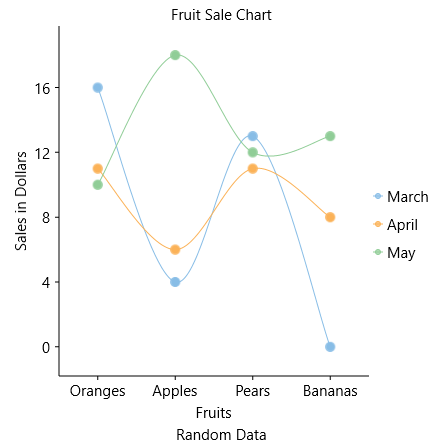
The SplineSymbols Chart combines the Spline Chart and the Scatter Chart. The chart plots data points by using symbols and connects those data points by using splines.
To create the SplineSymbols Chart, set the ChartType property to SplineSymbols.
Set the Stacking property to Stacked or Stacked100pc to create the stacking SplineSymbols Chart.