In this step, we will create a new Visual Studio application, add the appropriate references for the project, and add XAML markup to create the FlexChart control.
The necessary namespaces and control markup are added in the MainPage.xaml as shown:
| XAML |
Copy Code
|
|---|---|
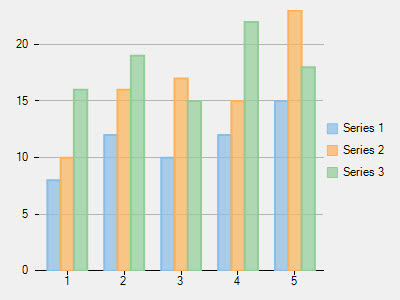
<Page xmlns="http://schemas.microsoft.com/winfx/2006/xaml/presentation" xmlns:x="http://schemas.microsoft.com/winfx/2006/xaml" xmlns:local="using:App1" xmlns:d="http://schemas.microsoft.com/expression/blend/2008" xmlns:mc="http://schemas.openxmlformats.org/markup-compatibility/2006" xmlns:Chart="using:C1.Xaml.Chart" xmlns:Xaml="using:C1.Xaml" xmlns:Foundation="using:Windows.Foundation" x:Class="App1.MainPage" mc:Ignorable="d"> <Grid Background="{ThemeResource ApplicationPageBackgroundThemeBrush}"> <Chart:C1FlexChart x:Name="flexChart" HorizontalAlignment="Left" Height="300" VerticalAlignment="Top" Width="300" Xaml:C1NagScreen.Nag="True"> <Chart:Series Binding="Y" BindingX="X" SeriesName="Series 1"> <Chart:Series.ItemsSource> <PointCollection> <Foundation:Point>1,8</Foundation:Point> <Foundation:Point>2,12</Foundation:Point> <Foundation:Point>3,10</Foundation:Point> <Foundation:Point>4,12</Foundation:Point> <Foundation:Point>5,15</Foundation:Point> </PointCollection> </Chart:Series.ItemsSource> </Chart:Series> <Chart:Series Binding="Y" BindingX="X" SeriesName="Series 2"> <Chart:Series.ItemsSource> <PointCollection> <Foundation:Point>1,10</Foundation:Point> <Foundation:Point>2,16</Foundation:Point> <Foundation:Point>3,17</Foundation:Point> <Foundation:Point>4,15</Foundation:Point> <Foundation:Point>5,23</Foundation:Point> </PointCollection> </Chart:Series.ItemsSource> </Chart:Series> <Chart:Series Binding="Y" BindingX="X" SeriesName="Series 3"> <Chart:Series.ItemsSource> <PointCollection> <Foundation:Point>1,16</Foundation:Point> <Foundation:Point>2,19</Foundation:Point> <Foundation:Point>3,15</Foundation:Point> <Foundation:Point>4,22</Foundation:Point> <Foundation:Point>5,18</Foundation:Point> </PointCollection> </Chart:Series.ItemsSource> </Chart:Series> </Chart:C1FlexChart> </Grid> </Page> |
|