In some scenarios, you might want to visualize a bit more than a single pie chart, and use multiple Pie Charts together. The FlexPie control empowers a user to create multiple Pie Charts based on the same data source. The user can create multiple pie charts by simply specifying several comma-separated strings of field names in the Binding property of C1FlexPie class. This means you don't have to add any additional FlexPie controls for multiple Pie Charts.
Multiple Pie Charts can help compare data across different groups. It is also the right visualization choice to present key indicators/facts about your topic of interest.
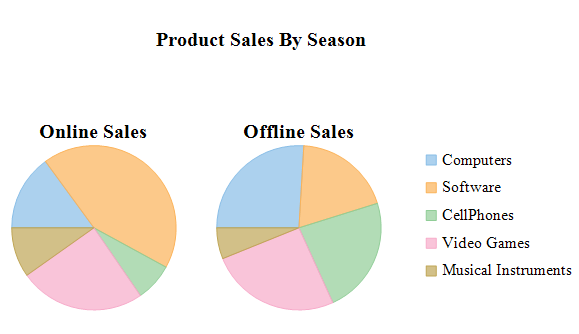
The following image shows two Pie Charts, Online Sales and Offline Sales for five different products. Computer, Software, CellPhones, Video Games and Musical Instruments.
Adding multiple pie charts using the same data source is depicted programmatically below:
Adding multiple pie charts using the same data source is depicted programmatically below: