ComponentOne BarChart for ASP.NET WebForms
Client-Side Tutorials / Drilling Down in BarChart Data / Step 4 of 4: Run Your Application
In This Topic
    Step 4 of 4: Run Your Application
    In This Topic

    In this step, you'll run your application and test some of the application's run-time capabilities.

    1. Press F5 or start debugging to run your application. Initially, your application should resemble the following image:
    2. If you click on one of the chart's bars, for this example the 2012 bar, your application will appear as in the following image:
    3. You can drill-down one more level by clicking on one of the months. For this example, select Dec:

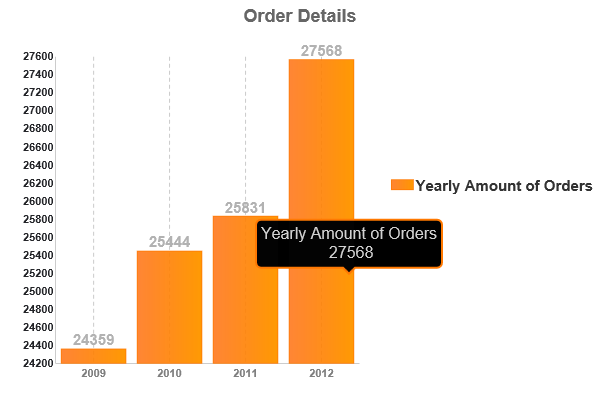
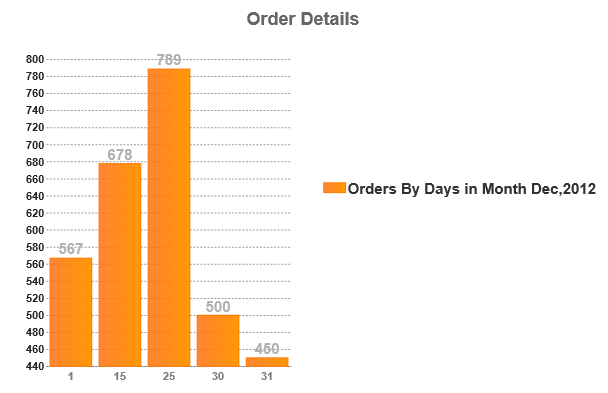
    Congratulations! You have completed the Drilling Down in BarChart Data tutorial! In this tutorial, you created an ASP.NET Web Forms Edition application, added references to Wijmo, and added markup and script to the application. When you ran your application, you observed the drill-down capabilities of the application.