Tick marks are the lines that appear perpendicular to the axis to display the units of measurement in the chart. Major and minor tick marks can be shown on the bubble chart when the ChartAxisTick.Positon is set to Cross or Outside. Customizing the tick spacing or attributes is as easy as manipulating a set of properties.
The TickMajor and TickMinor properties set the state of the Axis' tick marks. This property can be set to any of the ChartAxisTickPosition values.
Tick Mark Position
These values set where and if the tick marks will be displayed:
| Value | Description |
|---|---|
| ChartAxisTickPosition.None | No tick marks along axis. |
| ChartAxisTickPosition.Cross | Tick marks cross over axis. |
| ChartAxisTickPosition.Outside | Tick marks located outside chart area on axis. |
| ChartAxisTickPosition.Inside | Tick marks located inside chart area on axis. |
Tick Mark Spacing
The AutoMajor and AutoMinor properties set whether the tick marks are to be automatically configured by the chart. When both these properties are set to True, the chart uses the current data to logically place the major and minor tick marks. When the AutoMajor property is true, its not necessary to enable overlap for axis annotations.
The UnitMajor and UnitMinor properties set the units by which the ticks will be spaced. When the UnitMajor property is set, the UnitMinor property is automatically set by the chart to half the UnitMajor value. Although the chart automatically sets the UnitMinor property, it also can be manually changed to a different value.
Tick Mark Length
You can increase the length of the Major and Minor tick marks using the Factor property. Before using the Factor property set the Position to Outside or Cross. Tick marks are sized based on the thickness of the axis line as well as the tick factor. Doubling the tick factor doubles the length of the axis tick mark. If negative values are used for the X-axis tick marks, the tick marks will appear above the x-axis labels. If negative values are used for the y-axis tick marks, the tick marks will appear to the left of the y-axis labels.
Note: When increasing the value ChartAxisTick.Factor property, the appropriate MarginBottom, MarginLeft, MarginRight, or MarginTop property should also be increased for adequate space for the increased length of the tick marks.
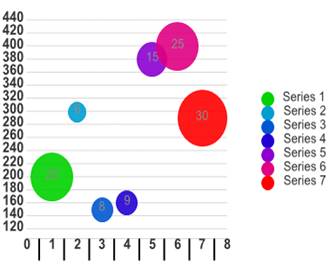
The following chart image has the Factor property for the major tick marks set to 5 and the MarginBottom to 40. This makes the tick length for the major tick marks five times longer.
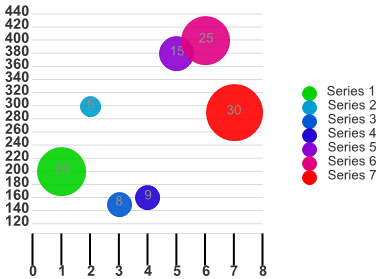
The following chart image has the Factor property for the minor tick marks set to 5. This makes the tick length for the minor tick marks five times longer.