Grid lines are lines that appear perpendicular with major/minor tick marks at unit major/minor intervals. The lines that appear perpendicular to an axis at Major intervals are controlled by the ChartAxis.GridMajor property and the lines that appear perpendicular to an axis at Minor intervals are controlled by the ChartAxis.GridMinor property. Grid lines can help improve the readability of the Chart when you are looking for exact values.
You can set the GridMajor and GridMinor properties for both the X and Y axes, as in the following markup:
| Markup |
Copy Code
|
|---|---|
<Axis>
    <X>
        <GridMajor Visible="True">
            <Style Stroke="#0099FF" StrokeDashArray="2,2" StrokeLineCap="bevel" StrokeLineJoin="round"></Style>
            <GridStyle Stroke="#0099FF" StrokeDashArray="2,2" StrokeLineCap="bevel" StrokeLineJoin="round"></GridStyle>
        </GridMajor>
        <GridMinor Visible="True">
            <Style Stroke="#0099FF">
            </Style>
            <GridStyle Stroke="#0099FF">
            </GridStyle>
        </GridMinor>
    </X>
    <Y Visible="False" Compass="West">
        <Labels TextAlign="Center"></Labels>
        <GridMajor Visible="True">
            <Style Stroke="#B300B3"></Style>
            <GridStyle Stroke="#B300B3"></GridStyle>
        </GridMajor>
        <GridMinor Visible="False"></GridMinor>
    </Y>
</Axis>
|
|
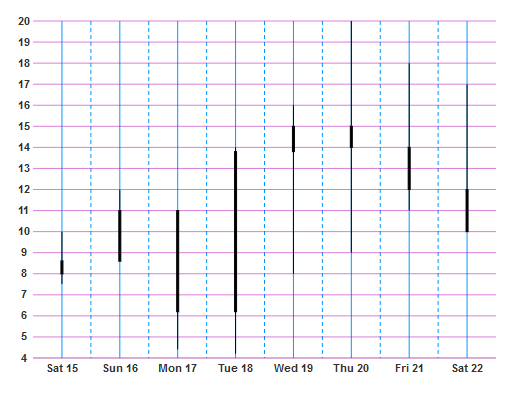
The properties set in the markup above will result in a chart that resembles the following image. In this image, the X axis has both Major and Minor gridlines visible. The GridMajor lines are solid, while the GridMinor lines are dashed: