Step 2 of 4: Adding a SeriesList to the Candlestick Chart
In This Topic
In this step, you will date time values to the X CandlestickChartSeries and double values to the other CandlestickChartSeries. You will also modify the series symbols and label.
- Click the CandlestickChart smart tag and select SeriesList from the C1CandlestickChart Tasks menu. The CandlestickChart Collection Editor will open.
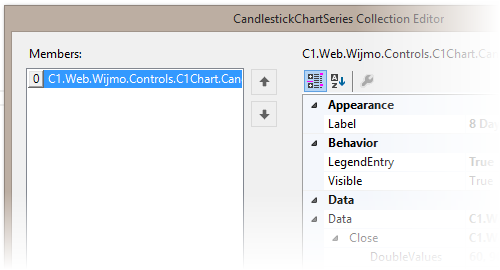
- Click Add to add a data series to the chart. In the right-hand pane, locate the Label property and give your data series a name.
- Next, locate the Data property. Open the Data options by clicking the drop-down arrow next to the property. There will be 5 options: Close, High, Low, Open, and X.
- Click the drop-down arrow next to the Close option. This will open the DoubleValues data option. Enter the following values:
- 60, 90, 45, 50, 22, 19, 40, 33
- Click the drop-down arrow next to the High option. This will open the DoubleValues data option. Enter the following values:
- 105, 98, 45, 50, 85, 40, 66, 92
- Click the drop-down arrow next to the Low option. This will open the DoubleValues data option. Enter the following values:
- 8, 5, 7, 16, 20, 19, 3, 9
- Click the drop-down arrow next to the Open option. Enter the following values:
- 100, 90, 32, 16, 20, 8, 17, 40
- Click the drop-down arrow next to the X option. Click the ellipses button
 in the Value option to open the ChartXData Collection Editor.
- In the Collection Editor, click the Add button eight times to add X values. Select the first item in the list in the left-hand pane and view the properties in the right-hand pane.
- Locate the DateTime property and set it to 03/15/2014.
- Follow these steps for the remaining seven items, so that you set dates from the 15th to the 22nd or March. Click OK.
- Click OK in the CandlestickChart Collection Editor to add the SeriesList data to your chart. The markup added to your application should resemble the following:
| Markup |
Copy Code
|
<cc1:C1CandlestickChart ID="C1CandlestickChart1" runat="server">
    <SeriesList>
        <cc1:CandlestickChartSeries Label="8 Days" LegendEntry="True">
            <Data>
                <High DoubleValues="105, 98, 45, 50, 85, 40, 66, 92"></High>
                <Low DoubleValues="8, 5, 7, 16, 20, 19, 3, 9"></Low>
                <Open DoubleValues="100, 90, 32, 16, 20, 8, 17, 40"></Open>
                <Close DoubleValues="60, 90, 45, 50, 22, 19, 40, 33"></Close>
                <X>
                    <Values>
                        <cc1:ChartXData DateTimeValue="2014-03-15"></cc1ChartXData>
                        <cc1:ChartXData DateTimeValue="2014-03-16"></cc1ChartXData>
                        <cc1:ChartXData DateTimeValue="2014-03-17"></cc1ChartXData>
                        <cc1:ChartXData DateTimeValue="2014-03-18"></cc1ChartXData>
                        <cc1:ChartXData DateTimeValue="2014-03-19"></cc1ChartXData>
                        <cc1:ChartXData DateTimeValue="2014-03-20"></cc1ChartXData>
                        <cc1:ChartXData DateTimeValue="2014-03-21"></cc1ChartXData>
                        <cc1:ChartXData DateTimeValue="2014-03-22"></cc1ChartXData>
                    </Values>
                </X>
            </Data>
        </cc1CandlestickChartSeries>
    </SeriesList>
</cc1C1CandlestickChart>
|
In this step, you added SeriesList data to your C1CandlestickChart control. In the next step, you'll customize the chart's appearance.
See Also