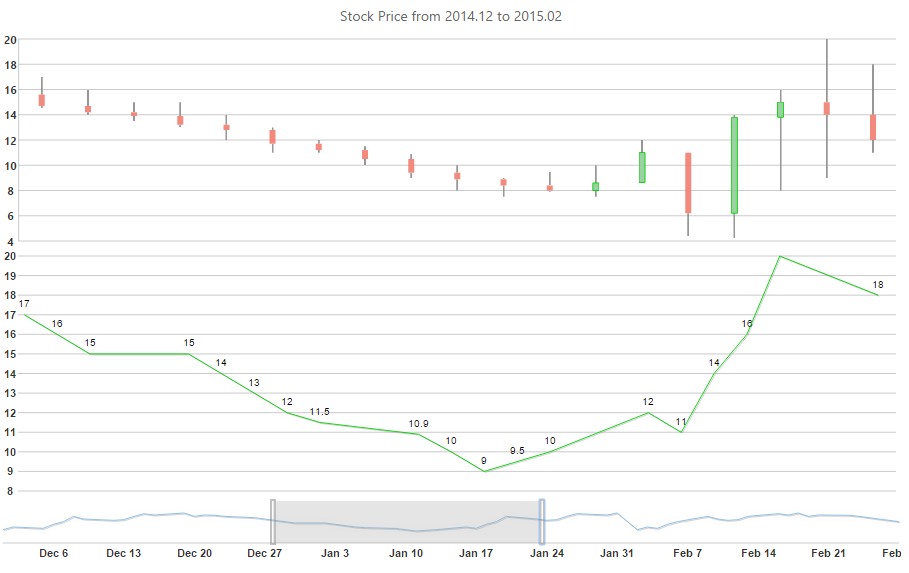
You can bind the ChartNavigator to more than one chart using the TargetSelector property. This scenario depicts stock price comparison between December 2014 to February 2015. The ChartNavigator is bound to CandlestickChart and LineChart. The CandlestickChart effectively shows the relationship between the open and close as well as high and low data values. The LineChart, on the other hand displays changes in values between different groups of data.
Complete the following steps to depict two charts data bound to one chart navigator.
| Source View |
Copy Code
|
|---|---|
<script type="text/javascript"> function hintContent() { return this.label + ' - ' + Globalize.format(this.x, "d") + '\n High:' + this.high + '\n Low:' + this.low + '\n Open:' + this.open + '\n Close:' + this.close; } </script> <cC1:C1CandlestickChart ID="C1CandlestickChart1" runat="server" Height="250" Width="900" MarginTop="5" MarginBottom="10" MarginLeft="5" MarginRight="5"> <Animation Enabled="false" /> <TextStyle FontFamily="Segoe UI, Frutiger, Frutiger Linotype, Dejavu Sans, H elvetica Neue, Arial, sans-serif" FontSize="13px"> </TextStyle> <Header Compass="North" Text="Stock Price from 2014.12 to 2015.02" TextStyle-FontSize="14px"></Header> <Legend Visible="false"></Legend> <Axis> <X Visible="false" TextVisible="false"> <GridMajor Visible="False"></GridMajor> </X> <Y Visible="true" Compass="West"> <GridMajor Visible="True"></GridMajor> <GridMinor Visible="False"></GridMinor> </Y> </Axis> <CandlestickChartSeriesStyles> <cC1:CandlestickChartStyle> <HighLow Width="2"> <Fill Color="#8C8C8C"></Fill> </HighLow> <FallingClose Width="6"> <Fill Color="#F07E6E"></Fill> </FallingClose> <RisingClose Width="6"> <Fill Color="#90CD97"></Fill> </RisingClose> </cC1:CandlestickChartStyle> </CandlestickChartSeriesStyles> <Hint> <ContentStyle FontFamily="Segoe UI, Frutiger, Frutiger Linotype, Dejavu Sans, Helvetica Neue, Arial, sans-serif" FontSize="12px"> </ContentStyle> <Content Function="hintContent" /> <HintStyle Stroke="Transparent"> <Fill Color="#444444"> </Fill> </HintStyle> </Hint> </cC1:C1CandlestickChart> <cC1:C1LineChart ID="C1LineChart1" runat="server" Height="250" Width="900" MarginTop="5" MarginBottom="10" MarginLeft="5" MarginRight="5" > <Animation Enabled="false" /> <Header Compass="North" ></Header> <Footer Compass="South" Visible="False"></Footer> <Legend Visible="false"></Legend> <Axis> <X Visible="false" TextVisible="false"> <GridMajor Visible="False"></GridMajor> <GridMinor Visible="False"></GridMinor> </X> <Y Visible="false" Compass="West"> <GridMajor Visible="True"></GridMajor> <GridMinor Visible="False"></GridMinor> </Y> </Axis> Hint Enable="False"> </Hint> <Indicator Visible="False"></Indicator> </cC1:C1LineChart> <cC1:C1ChartNavigator ID="ChartNavigator1" runat="server" Width="900" Height="56"> <SeriesStyles> <cC1:ChartStyle Fill-Color="#88bde6" Stroke="#88bde6"></cC1:ChartStyle> </SeriesStyles> </cC1:C1ChartNavigator> |
|
Add the following code to the Page_Load event to add stock data and bind two charts with the ChartNavigator.
| C# |
Copy Code
|
|---|---|
    if (!IsPostBack)
    {
        PrepareOptions();
    }
}
private void PrepareOptions()
{
    var valuesX = new List<DateTime?>(){
    DateTime.Parse("2014-12-01"),
    DateTime.Parse("2014-12-02"),
    DateTime.Parse("2014-12-05"),
    DateTime.Parse("2014-12-06"),
    DateTime.Parse("2014-12-07"),
    DateTime.Parse("2014-12-08"),
    DateTime.Parse("2014-12-09"),
    DateTime.Parse("2014-12-12"),
    DateTime.Parse("2014-12-13"),
    DateTime.Parse("2014-12-14"),
    DateTime.Parse("2014-12-15"),
    DateTime.Parse("2014-12-16"),
    DateTime.Parse("2014-12-19"),
    DateTime.Parse("2014-12-20"),
    DateTime.Parse("2014-12-21"),
    DateTime.Parse("2014-12-22"),
    DateTime.Parse("2014-12-23"),
    DateTime.Parse("2014-12-26"),
    DateTime.Parse("2014-12-27"),
    DateTime.Parse("2014-12-28"),
    DateTime.Parse("2014-12-29"),
    DateTime.Parse("2014-12-30"),
    DateTime.Parse("2015-01-02"),
    DateTime.Parse("2015-01-03"),
    DateTime.Parse("2015-01-04"),
    DateTime.Parse("2015-01-05"),
    DateTime.Parse("2015-01-06"),
    DateTime.Parse("2015-01-09"),
    DateTime.Parse("2015-01-10"),
    DateTime.Parse("2015-01-11"),
    DateTime.Parse("2015-01-12"),
    DateTime.Parse("2015-01-13"),
    DateTime.Parse("2015-01-16"),
    DateTime.Parse("2015-01-17"),
    DateTime.Parse("2015-01-18"),
    DateTime.Parse("2015-01-19"),
    DateTime.Parse("2015-01-20"),
    DateTime.Parse("2015-01-23"),
    DateTime.Parse("2015-01-24"),
    DateTime.Parse("2015-01-25"),
    DateTime.Parse("2015-01-26"),
    DateTime.Parse("2015-01-27"),
    DateTime.Parse("2015-01-30"),
    DateTime.Parse("2015-01-31"),
    DateTime.Parse("2015-02-02"),
    DateTime.Parse("2015-02-03"),
    DateTime.Parse("2015-02-04"),
    DateTime.Parse("2015-02-05"),
    DateTime.Parse("2015-02-06"),
    DateTime.Parse("2015-02-09"),
    DateTime.Parse("2015-02-10"),
    DateTime.Parse("2015-02-11"),
    DateTime.Parse("2015-02-12"),
    DateTime.Parse("2015-02-13"),
    DateTime.Parse("2015-02-16"),
    DateTime.Parse("2015-02-17"),
    DateTime.Parse("2015-02-18"),
    DateTime.Parse("2015-02-19"),
    DateTime.Parse("2015-02-20"),
    DateTime.Parse("2015-02-23"),
    DateTime.Parse("2015-02-24"),
    DateTime.Parse("2015-02-25"),
    DateTime.Parse("2015-02-26"),
    DateTime.Parse("2015-02-27"),
    DateTime.Parse("2015-02-28")
    };
    var valuesY = new List<double?>() { 10,12,11,14,16,20,18,17,17.5,20,22,21,22.5,20,21,20.8,20,19,18,17,16,15,15,14,13,12,
                11.5,10.9,10,9,9.5,10,12,11,14,16,20,18,17,17.5,20,22,21,22.5,10,12,11,14,16,20,18,17,17.5,20,22,21,22.5,20,21,20.8,20,19,18,17,16 };
    var valuesHigh = new List<double?>() { 10,12,11,14,16,20,18,17,17.5,20,22,21,22.5,20,21,20.8,20,19,18,17,16,15,15,14,13,12,
                11.5,10.9,10,9,9.5,10,12,11,14,16,20,18,17,17.5,20,22,21,22.5,10,12,11,14,16,20,18,17,17.5,20,22,21,22.5,20,21,20.8,20,19,18,17,16 };
    var valuesLow = new List<double?>() { 7.5,8.6,4.4,4.2,8,9,11,10,12.2,12,16,15.5,16,15,16,16.5,16,16,15,14.5,14,13.5,13,12,11,
                11,10,9,8,7.5,7.9,7.5,8.6,4.4,4.2,8,9,11,10,12.2,12,16,15.5,16,10,12,11,14,16,20,18,17,17.5,20,22,21,22.5,20,21,20.8,20,19,18,17,16 };
    var valuesOpen = new List<double?>() { 8,8.6,11,6.2,13.8,15,14,12,16,15,17,18,17.2,18.5,17.8,18.6,19.8,18,16.9,15.6,14.7,14.2,13.9,13.2,
                12.8,11.7,11.2,10.5,9.4,8.9,8.4,8,8.6,11,6.2,13.8,15,14,12,16,15,17,18,17.2,10,12,11,14,16,20,18,17,17.5,20,22,21,22.5,20,21,20.8,20,19,18,17,16 };
    var valuesClose = new List<double?>() { 8.6,11,6.2,13.8,15,14,12,16,15,17,18,17.2,18.5,17.8,18.6,19.8,18,16.9,15.6,14.7,14.2,13.9,13.2,
                12.8,11.7,11.2,10.5,9.4,8.9,8.4,8,8.6,11,6.2,13.8,15,14,12,16,15,17,18,17.2,18.5,10,12,11,14,16,20,18,17,17.5,20,22,21,22.5,20,21,20.8,20,19,18,17,16};
    var candleSeries = new CandlestickChartSeries();
    candleSeries.Data.X.AddRange(valuesX.ToArray<DateTime?>());
    candleSeries.Data.High.AddRange(valuesHigh.ToArray<double?>());
    candleSeries.Data.Low.AddRange(valuesLow.ToArray<double?>());
    candleSeries.Data.Open.AddRange(valuesOpen.ToArray<double?>());
    candleSeries.Data.Close.AddRange(valuesClose.ToArray<double?>());
    candleSeries.Label = "MSFT";
    candleSeries.LegendEntry = true;
    this.C1CandlestickChart1.SeriesList.Add(candleSeries);
    var lineSeries = new LineChartSeries();
    lineSeries.Data.X.AddRange(valuesX.ToArray<DateTime?>());
    lineSeries.Data.Y.AddRange(valuesY.ToArray<double?>());
    this.ChartNavigator1.SeriesList.Add(lineSeries);
    this.C1LineChart1.SeriesList.Add(lineSeries);
    this.ChartNavigator1.TargetSelector = "#" + this.C1CandlestickChart1.ClientID + ", #" + this.C1LineChart1.ClientID; ;
    this.ChartNavigator1.RangeMin = DateTime.Parse("2014-12-14").ToOADate();
    this.ChartNavigator1.RangeMax = DateTime.Parse("2015-01-04").ToOADate();
}
}
|
|
| VB |
Copy Code
|
|---|---|
           If Not IsPostBack Then
               PrepareOptions()
           End If
       End Sub
       Private Sub PrepareOptions()
        Dim valuesX = New List(Of System.Nullable(Of DateTime))() From {
              DateTime.Parse("2014-12-01"),
              DateTime.Parse("2014-12-02"),
              DateTime.Parse("2014-12-05"),
              DateTime.Parse("2014-12-06"),
              DateTime.Parse("2014-12-07"),
              DateTime.Parse("2014-12-08"),
              DateTime.Parse("2014-12-09"),
              DateTime.Parse("2014-12-12"),
              DateTime.Parse("2014-12-13"),
              DateTime.Parse("2014-12-14"),
              DateTime.Parse("2014-12-15"),
              DateTime.Parse("2014-12-16"),
              DateTime.Parse("2014-12-19"),
              DateTime.Parse("2014-12-20"),
              DateTime.Parse("2014-12-21"),
              DateTime.Parse("2014-12-22"),
              DateTime.Parse("2014-12-23"),
              DateTime.Parse("2014-12-26"),
              DateTime.Parse("2014-12-27"),
              DateTime.Parse("2014-12-28"),
              DateTime.Parse("2014-12-29"),
              DateTime.Parse("2014-12-30"),
              DateTime.Parse("2015-01-02"),
              DateTime.Parse("2015-01-03"),
              DateTime.Parse("2015-01-04"),
              DateTime.Parse("2015-01-05"),
              DateTime.Parse("2015-01-06"),
              DateTime.Parse("2015-01-09"),
              DateTime.Parse("2015-01-10"),
              DateTime.Parse("2015-01-11"),
              DateTime.Parse("2015-01-12"),
              DateTime.Parse("2015-01-13"),
              DateTime.Parse("2015-01-16"),
              DateTime.Parse("2015-01-17"),
              DateTime.Parse("2015-01-18"),
              DateTime.Parse("2015-01-19"),
              DateTime.Parse("2015-01-20"),
              DateTime.Parse("2015-01-23"),
              DateTime.Parse("2015-01-24"),
              DateTime.Parse("2015-01-25"),
              DateTime.Parse("2015-01-26"),
              DateTime.Parse("2015-01-27"),
              DateTime.Parse("2015-01-30"),
              DateTime.Parse("2015-01-31")
          }

           Dim valuesY = New List(Of System.Nullable(Of Double))() From {
               10, 12, 11, 14, 16, 20, 18, 17, 17.5, 20, 22, 21, 22.5,
               20, 21, 20.8, 20, 19, 18, 17, 16, 15, 15, 14, 13, 12, 11.5,
               10.9, 10, 9, 9.5, 10, 12, 11, 14, 16, 20, 18, 17, 17.5, 20,
               22, 21, 22.5
           }
           Dim valuesHigh = New List(Of System.Nullable(Of Double))() From {
               10, 12, 11, 14, 16, 20, 18, 17, 17.5, 20, 22, 21, 22.5,
               20, 21, 20.8, 20, 19, 18, 17, 16, 15, 15, 14, 13, 12, 11.5,
               10.9, 10, 9, 9.5, 10, 12, 11, 14, 16, 20, 18, 17, 17.5, 20,
               22, 21, 22.5
           }
           Dim valuesLow = New List(Of System.Nullable(Of Double))() From {
               7.5, 8.6, 4.4, 4.2, 8, 9, 11, 10, 12.2, 12, 16, 15.5, 16, 15,
               16, 16.5, 16, 16, 15, 14.5, 14, 13.5, 13, 12, 11, 11, 10, 9, 8,
               7.5, 7.9, 7.5, 8.6, 4.4, 4.2, 8, 9, 11, 10, 12.2, 12, 16, 15.5, 16
           }
           Dim valuesOpen = New List(Of System.Nullable(Of Double))() From {
              8, 8.6, 11, 6.2, 13.8, 15, 14, 12, 16, 15, 17, 18, 17.2, 18.5, 17.8,
              18.6, 19.8, 18, 16.9, 15.6, 14.7, 14.2, 13.9, 13.2, 12.8, 11.7, 11.2,
              10.5, 9.4, 8.9, 8.4, 8, 8.6, 11, 6.2, 13.8, 15, 14, 12, 16, 15, 17, 18, 17.2
           }
           Dim valuesClose = New List(Of System.Nullable(Of Double))() From {
               8.6, 11, 6.2, 13.8, 15, 14, 12, 16, 15, 17, 18, 17.2, 18.5, 17.8,
               18.6, 19.8, 18, 16.9, 15.6, 14.7, 14.2, 13.9, 13.2, 12.8, 11.7, 11.2,
             10.5, 9.4, 8.9, 8.4, 8, 8.6, 11, 6.2, 13.8, 15, 14, 12, 16, 15, 17, 18, 17.2, 18.5
           }
           Dim candleSeries = New CandlestickChartSeries()
           candleSeries.Data.X.AddRange(valuesX.ToArray(Of System.Nullable(Of DateTime))())
           candleSeries.Data.High.AddRange(valuesHigh.ToArray(Of System.Nullable(Of Double))())
           candleSeries.Data.Low.AddRange(valuesLow.ToArray(Of System.Nullable(Of Double))())
           candleSeries.Data.Open.AddRange(valuesOpen.ToArray(Of System.Nullable(Of Double))())
           candleSeries.Data.Close.AddRange(valuesClose.ToArray(Of System.Nullable(Of Double))())
           candleSeries.Label = "MSFT"
           candleSeries.LegendEntry = True
           Me.C1CandlestickChart1.SeriesList.Add(candleSeries)
           Dim lineSeries = New LineChartSeries()
           lineSeries.Data.X.AddRange(valuesX.ToArray(Of System.Nullable(Of DateTime))())
           lineSeries.Data.Y.AddRange(valuesY.ToArray(Of System.Nullable(Of Double))())
           Me.ChartNavigator1.SeriesList.Add(lineSeries)
           Me.C1LineChart1.SeriesList.Add(lineSeries)
           Me.ChartNavigator1.TargetSelector = "#" + Me.C1CandlestickChart1.ClientID + ","
#" + Me.C1LineChart1.ClientID
           Me.ChartNavigator1.RangeMin = DateTime.Parse("2014-12-14").ToOADate()
           Me.ChartNavigator1.RangeMax = DateTime.Parse("2015-01-04").ToOADate()
       End Sub
   End Class
|
|
When you run your application, the ChartNavigator appears as shown in the image below: