ComponentOne CompositeChart for ASP.NET Web Forms
Task-Based Help / Adding a Pie Chart to the C1Composite Chart
In This Topic
    Adding a Pie Chart to the C1Composite Chart
    In This Topic

    The following steps show how to create data for the Pie chart in the C1Composite chart at design time and through source code.

    In the Designer

    To add Pie chart data to the C1CompositeChart, follow these steps:

    1. Click C1CompositeChart's smart tag to open the C1CompositeChart Tasks menu.
    2. In the CompositeChartSeries Collection Editor, click the Add button once to add one CompositeChartSeries to the CompositeChart. Set the member’s properties to the following:

      Member

      Type

      Label

      Center

      3

      Pie

      abc

      150, 150

    3. Click on the ellipsis button next to the PieSeriesList to open the PieChartSeries Collection Editor.
    4. Click Add three times to add three new PieChartSeries to the CompositeChart and then set each member to the following:

      Member

      Label

      Data

      Offset

      0

      MacBook Pro

      46.78

      15

      1

      iMac

      23.18

      0

      2

      MacBook

      20.25

      0

    5. Click the OK to save and close the PieChartSeries Collection Editor and then click OK to save and close the CompositeChartSeries Collection Editor.

    In Source View

    To add a Pie chart data to the C1CompositeChart, use the following source code:

    Source View
    Copy Code
    <wijmo:C1CompositeChart ID="C1CompositeChart1" runat="server">
          <SeriesList>
              <wijmo:CompositeChartSeries Center="150, 150" Label="abc" LegendEntry="True"
                    Type="Pie">
                    <PieSeriesList>
                        <wijmo:PieChartSeries Data="46.78" HintContent="" Label="MacBook Pro"
                            LegendEntry="True" Offset="15">
                        </wijmo:PieChartSeries>
                        <wijmo:PieChartSeries Data="23.18" HintContent="" Label="iMac"
                            LegendEntry="True">
                        </wijmo:PieChartSeries>
                        <wijmo:PieChartSeries Data="20.25" HintContent="" Label="MacBook"
                            LegendEntry="True">
                        </wijmo:PieChartSeries>
                    </PieSeriesList>
                </wijmo:CompositeChartSeries>
            </SeriesList>
           <Header Compass="North"></Header>
           <Footer Compass="South" Visible="False"></Footer>
           <Axis>
              <X>
                   <GridMajor Visible="True"></GridMajor>
                   <GridMinor Visible="False"></GridMinor>
              </X>
              <Y Visible="False" Compass="West">
               <Labels TextAlign="Center"></Labels> 
                   <GridMajor Visible="True"></GridMajor>
                   <GridMinor Visible="False"></GridMinor>
              </Y>
           </Axis>
    </wijmo:C1CompositeChart>
    

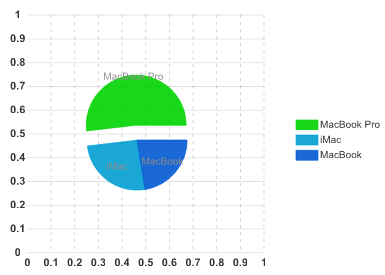
    This Topic Illustrates the Following:

    The following image shows a C1PieChart with 3 series: