To create a spline chart in the C1CompositeChart complete the following
|
Member |
DateTimeValue |
|
0 |
12/10/2012 |
|
1 |
12/11/2012 |
|
2 |
12/12/2012 |
|
3 |
12/13/2012 |
|
4 |
12/14/2012 |
|
5 |
12/15/2012 |
|
6 |
12/16/2012 |
|
7 |
12/17/2012 |
|
8 |
12/18/2012 |
|
Member |
DoubleValue |
|
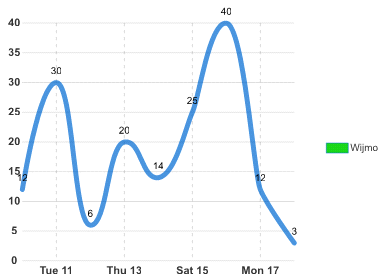
0 |
12 |
|
1 |
30 |
|
2 |
6 |
|
3 |
20 |
|
4 |
14 |
|
5 |
25 |
|
6 |
40 |
|
7 |
12 |
|
|
3 |
Use the following code to create the Spline chart in the C1Composite Chart:
| Source View |
Copy Code
|
|---|---|
<wijmo:C1CompositeChart ID="C1CompositeChart1" runat="server" Height="300px" Width="400px"> <SeriesList> <wijmo:CompositeChartSeries Label="Wijmo" LegendEntry="True" Type="Spline"> <Data> <X> <Values> <wijmo:ChartXData DateTimeValue="2012-12-10" /> <wijmo:ChartXData DateTimeValue="2012-12-11" /> <wijmo:ChartXData DateTimeValue="2012-12-12" /> <wijmo:ChartXData DateTimeValue="2012-12-13" /> <wijmo:ChartXData DateTimeValue="2012-12-14" /> <wijmo:ChartXData DateTimeValue="2012-12-15" /> <wijmo:ChartXData DateTimeValue="2012-12-16" /> <wijmo:ChartXData DateTimeValue="2012-12-17" /> <wijmo:ChartXData DateTimeValue="2012-12-18" /> </Values> </X> <Y> <Values> <wijmo:ChartYData DoubleValue="12" /> <wijmo:ChartYData DoubleValue="30" /> <wijmo:ChartYData DoubleValue="6" /> <wijmo:ChartYData DoubleValue="20" /> <wijmo:ChartYData DoubleValue="14" /> <wijmo:ChartYData DoubleValue="25" /> <wijmo:ChartYData DoubleValue="40" /> <wijmo:ChartYData DoubleValue="12" /> <wijmo:ChartYData DoubleValue="3" /> </Values> </Y> </Data> </wijmo:CompositeChartSeries> </SeriesList> <SeriesStyles> <wijmo:ChartStyle Stroke="#0066CC" StrokeOpacity="0.8" StrokeWidth="5"> </wijmo:ChartStyle> </SeriesStyles> <Header Compass="North"></Header> <Footer Compass="South" Visible="False"></Footer> <Axis> <X> <GridMajor Visible="True"></GridMajor> <GridMinor Visible="False"></GridMinor> </X> <Y Visible="False" Compass="West"> <Labels TextAlign="Center"></Labels> <GridMajor Visible="True"></GridMajor> <GridMinor Visible="False"></GridMinor> </Y> </Axis> </wijmo:C1CompositeChart> |
|
This Topic Illustrates the Following:
The following image shows a C1CompositeChart with a Spline chart: