The following steps show how to create two Pie charts for the C1CompositeChart in design time and in source code:
To add Pie chart data to the C1CompositeChart, follow these steps:
|
Member |
Type |
Radius |
Center |
|
0 |
Pie |
100 |
400, 250 |
|
Member |
Label |
Data |
Offset |
|
0 |
Chrome |
38 |
0 |
|
1 |
Firefox |
36 |
0 |
|
2 |
IE |
13 |
0 |
|
3 |
Safari |
8 |
0 |
|
4 |
Other |
5 |
0 |
|
Member |
Type |
Center |
|
1 |
Pie |
400, 250 |
|
Member |
Label |
Data |
Offset |
LegendEntry |
|
0 |
15 |
26 |
0 |
False |
|
1 |
14 |
8 |
0 |
False |
|
2 |
|
4 |
0 |
False |
|
3 |
7 |
20 |
0 |
False |
|
4 |
8 |
10 |
0 |
False |
|
5 |
|
6 |
0 |
False |
|
6 |
9 |
6 |
0 |
False |
|
7 |
8 |
5 |
0 |
False |
|
8 |
|
2 |
0 |
False |
|
9 |
5 |
5 |
0 |
False |
|
10 |
|
3 |
0 |
False |
|
11 |
|
5 |
0 |
False |
Add Two Pie Charts to the C1Composite chart through source code:
To add two Pie charts to C1CompositeChart, use the following source code:
<cc1:C1CompositeChart ID="C1CompositeChart1" runat="server" Height="475px"
Width="750px">
<SeriesList>
<cc1:CompositeChartSeries Center="400, 250" LegendEntry="True" Type="Pie"
Radius="100">
<PieSeriesList>
<cc1:PieChartSeries Data="38" HintContent="" Label="Chrome"
LegendEntry="True">
<cc1:PieChartSeries>
<cc1:PieChartSeries Data="36" HintContent="" Label="FireFox"
LegendEntry="True">
<cc1:PieChartSeries>
<cc1:PieChartSeries Data="13" HintContent="" Label="IE" LegendEntry="True">
<cc1:PieChartSeries>
<cc1:PieChartSeries Data="8" HintContent="" Label="Safari" LegendEntry="True">
<cc1:PieChartSeries>
<cc1:PieChartSeries Data="5" HintContent="" Label="Other" LegendEntry="True">
<cc1:PieChartSeries>
</PieSeriesList>
<cc1:CompositeChartSeries>
<cc1:CompositeChartSeries Center="400, 250" LegendEntry="True"
Type="Pie">
<PieSeriesList>
<cc1:PieChartSeries Data="26" HintContent="" Label="15" LegendEntry="False">
<cc1:PieChartSeries>
<cc1:PieChartSeries Data="8" HintContent="" Label="14" LegendEntry="False">
<cc1:PieChartSeries>
<cc1:PieChartSeries Data="4" HintContent="" LegendEntry="False" Label="4">
<cc1:PieChartSeries>
<cc1:PieChartSeries Data="20" HintContent="" Label="7" LegendEntry="False">
<cc1:PieChartSeries>
<cc1:PieChartSeries Data="10" HintContent="" Label="8" LegendEntry="False">
<cc1:PieChartSeries>
<cc1:PieChartSeries Data="6" HintContent="" Label="6" LegendEntry="False">
<cc1:PieChartSeries>
<cc1:PieChartSeries Data="6" HintContent="" Label="9" LegendEntry="False">
<cc1:PieChartSeries>
<cc1:PieChartSeries Data="5" HintContent="" Label="8" LegendEntry="False">
<cc1:PieChartSeries>
<cc1:PieChartSeries HintContent="" Label="2" LegendEntry="False" Data="2">
<cc1:PieChartSeries>
<cc1:PieChartSeries Data="5" HintContent="" Label="5" LegendEntry="False">
<cc1:PieChartSeries>
<cc1:PieChartSeries Data="3" HintContent="" Label="3" LegendEntry="False">
<cc1:PieChartSeries>
<cc1:PieChartSeries Data="5" HintContent="" LegendEntry="False" Label="5">
<cc1:PieChartSeries>
</PieSeriesList>
<cc1:CompositeChartSeries>
</SeriesList>
<Header Compass="North"></Header>
<Footer Compass="South" Visible="False"></Footer>
<Axis>
<X AutoMajor="False" AutoMin="False">
<GridMajor Visible="True"></GridMajor>
<GridMinor Visible="False"></GridMinor>
</X>
<Y Visible="False" Compass="West" AutoMajor="False" AutoMin="False">
<Labels TextAlign="Center"></Labels>
<GridMajor Visible="True"></GridMajor>
<GridMinor Visible="False"></GridMinor>
</Y>
</Axis>
<cc1:C1CompositeChart>
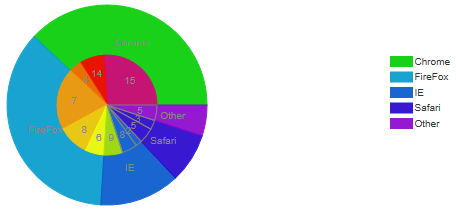
This Topic Illustrates the Following:
The following image shows a C1CompositeChart with an outer and inner Pie chart: