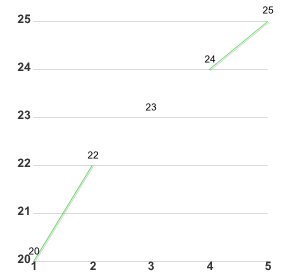
When gathered data is charted, it is sometimes necessary to visually provide an indication in the chart that data for a particular value is not available. For example, you can indicate that information is missing. A Data Hole is a break in data that are being charted, and is used in the chart to visually indicate that data is missing.
In C1LineChart, holes are specified by setting the data point to be excluded to a specific, otherwise unused value in the data arrays. The NumericHole property of the ChartHole object specifies the value to be used. For instance, assuming that the Hole value is set to -1000, and that data is unavailable for the third point of a series, a break or a hole can be introduced into the series plot by setting the Y value of the series point to -1000.
To specify a hole in the C1LineChart Visual Studio Properties window,
