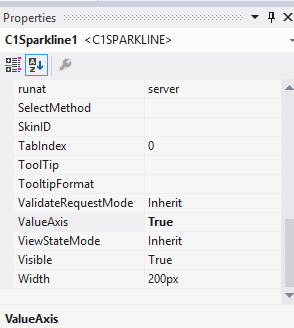
The following topic describes how to represent negative values below the ValueAxis and show positive and negative values in different colors in a Sparkline.
Complete the following steps to represent the negative values of the data below the ValueAxis of the Sparkline control.
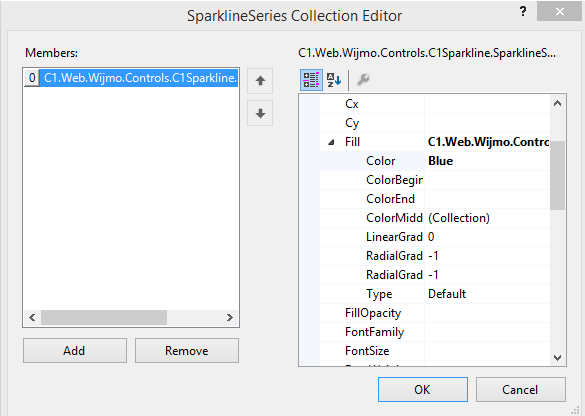
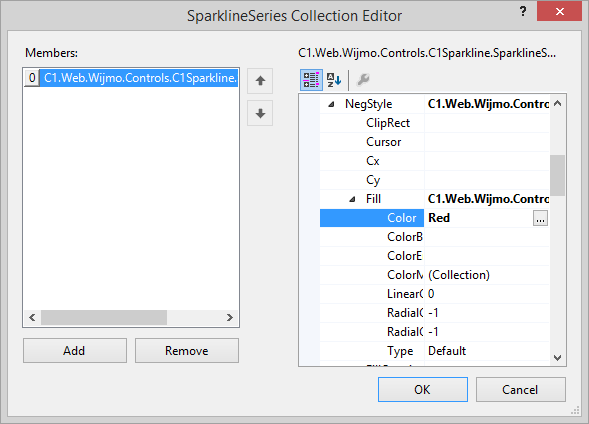
Complete the following steps to represent positive and negative values of the data in different colors on the Sparkline:
<cc1:C1Sparkline ID="C1Sparkline1" runat="server" ValueAxis="True" Height="50">
   <SeriesList>
      <cc1:SparklineSeries Type="column" SeriesStyle-Fill-Color="RoyalBlue"
SeriesStyle-NegStyle-Fill-Color="Red"> </cc1:SparklineSeries>
</SeriesList>
</cc1:C1Sparkline>
<SeriesList>
  <cc1:SparklineSeries Data="20, 40, 0, 10, 20, 25, 0, 45, 15, 0, 10, 20, 5,
   20, -10, 0, -20, 20, 10">
  </cc1:SparklineSeries>
</SeriesList>
Add the following code to the Page_Load event.
To write code in C#
double[] data = {20, 40, 0, 10, 20, 25, 0, 45, 15, 0, 10, 20, 5, 20,

   -10, 0, -20, 20, 10};
C1Sparkline1.SeriesList[0].Data = data;
To write code in VB
Dim data As Double() = {20, 40, 0,10, 20, 25,0, 45, 15, 0, 10, 20, 5,

    20,-10,0,-20,20,10}
C1Sparkline1.SeriesList(0).Data = data
When you run the project, the sparkline appears like the image below: