The major building blocks of the BulletGraph for WinForms are as follows:
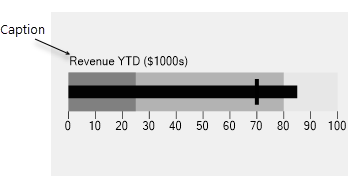
The Text Label or Caption in C1BulletGraph identifies the measure. The default formatting of Text Label in BulletGraph is with respect to position, color, orientation and size. In case of horizontally-oriented graphs, text labelling is aligned to the left by default, while in vertically-oriented graphs it is aligned at the top. The default font color of the text label is 100% black and legible.
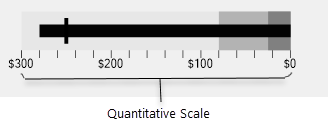
The quantitative scale of the BulletGraph resembles and functions like the quantitative scale of a two-dimensional XY graph. The quantitative scale consists of text labels and tick marks that identify equal intervals of measure, which can be observed along the top or bottom in the horizontally-oriented graph, or along the left or right side of the vertically-oriented graph. The tick marks can be assigned a position along the inner or outer edge of the plot area. The range of the quantitative feature usually begins at zero, but it may begin with a negative number or a value greater than zero if required.
The Featured Measure is the portion of the bullet graph that is visually prominent and it displays the primary data. This featureis encoded as a bar, like the bar on a bar graph. The only exception is when the quantitative scale begins at a value greater than zero. In such a case, the featured measure will be encoded as a symbol such as an X or a dot.
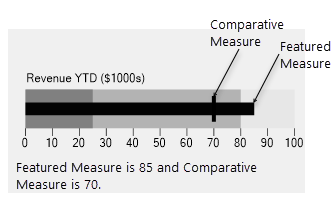
The Comparative measure is visually less dominant as compared to the featured measure, but easy to see in relation to the featured measure. It is encoded as a short line that runs perpendicular to the BulletGraph. Whenever the featured measure intersects a comparative measure, the comparative measure usually appears behind the featured measure.
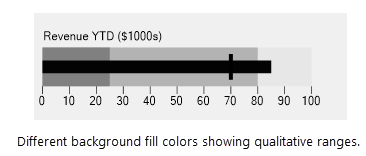
The qualitative ranges indicate the qualitative state of the featured measure and the degree to which it resides within that state. For example, if the measure extends into a range that represents “good”, then the distance that it travels into this range is indicative of how good it is. The number of qualitative ranges can span between two and five, though the ideal range is three.