ComponentOne BulletGraph for WinForms
Work with BulletGraph / Quantitative Scale
In This Topic
    Quantitative Scale
    In This Topic

    The quantitative scale of the bullet graph consists of tick marks and text labels that identify equal intervals of the featured measure. You can customize the range of the quantitative using the Minimum and Maximum properties of the C1BulletGraph class. Maximum specifies the end value of the scale, while Minimum specifies the start value of the scale.

    quantitative-bulletgraph 

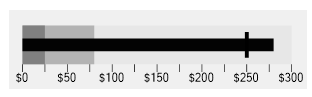
    The image depicts the quantitative scale of BulletGraph control.

    The code below shows how you can assign different values to Minimum and Maximum of the quantitative scale for a bullet graph:

    'Sets the starting value of the quantitative scale  
    C1BulletGraph1.Minimum = 0
    'Sets the ending value of the quantitative scale
    C1BulletGraph1.Maximum = 300
    
    //Sets the starting value of the quantitative scale  
    c1BulletGraph1.Minimum = 0;
    //Sets the ending value of the quantitative scale
    c1BulletGraph1.Maximum = 300;   
    

    The C1BulletGraph class also provides a GraphScale property to customize the bullet graph scale. This property is of the type BulletGraphScale class. The BulletGraphScale class contans the properties such as MarksInterval and LabelsInterval to change the space between each tick mark and label on the scale of a bullet graph. You can further choose to show or hide the scale labels and scale marks in a bullet graph with ShowLabels and ShowMarks properties of the BulletGraphScale class. You can also specify formatting for the scale labels with the Format property.

    The bullet graph scale can be customized as shown in the code below:

    'Sets the space between each tick mark on the quantitative scale
    C1BulletGraph1.GraphScale.MarksInterval = 25
    'Sets the space between each label on the quantitative scale 
    C1BulletGraph1.GraphScale.LabelsInterval = 50
    'Displays the scale labels
    C1BulletGraph1.GraphScale.ShowLabels = True
    'Displays the scale marks
    C1BulletGraph1.GraphScale.ShowMarks = True
    'Specify formatting for the scale labels
    C1BulletGraph1.GraphScale.Format = "$#,##0"
    
    //Sets the space between each tick mark on the quantitative scale
    c1BulletGraph1.GraphScale.MarksInterval = 25;  
    //Sets the space between each label on the quantitative scale            
    c1BulletGraph1.GraphScale.LabelsInterval = 50;
    //Displays the scale labels
    c1BulletGraph1.GraphScale.ShowLabels = true; 
    //Displays the scale marks
    c1BulletGraph1.GraphScale.ShowMarks = true; 
    //Specify formatting for the scale labels
    c1BulletGraph1.GraphScale.Format = "$#,##0"; 
    

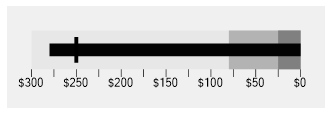
    The BulletGraph control also allows you to show the scale values in reversed order, that is from maximum to minimum using the IsReversed property of the C1BulletGraph class.

    'Shows the scale values in reversed order (Maximum to Minimum)
    C1BulletGraph1.IsReversed = True
    
    //Shows the scale values in reversed order (Maximum to Minimum)
    c1BulletGraph1.IsReversed = true; 
    

    The bar which is used to encode the featured measure begins from the minimum value of the scale. This is a default setting. However, in case you want to start the bar from a different value, you can use the Origin property of the C1BulletGraph class. The Origin property becomes useful when you want to start the featured measure bar from zero rather than a negative value.

    'Sets the origin of the bar that represents the featured measure
    C1BulletGraph1.Origin = 0
    
    //Sets the origin of the bar that represents the featured measure
    c1BulletGraph1.Origin = 0; 
    

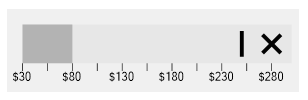
    If the quantitative scale begins at a value greater than zero, that is the minimum value of the scale is set to a value which is greater than zero, then the featured measure is represented on the bullet graph by the symbol ‘X' instead of a bar. 

    'Sets the starting value of the quantitative scale to a value greater than zero
    C1BulletGraph1.Minimum = 30
    
    //Sets the starting value of the quantitative scale to a value greater than zero
    c1BulletGraph1.Minimum = 30; 
    

    For example, the code given above sets the minimum value of the quantitative scale to a value greater than zero, say 30, hence the featured measure is represented by the symbol ‘X’ in the BulletGraph control as depicted in the image shown below.