To add ToolTips to the Chart's DataSeries, complete the following steps:
To write code in Visual Basic
| Visual Basic |
Copy Code
|
|---|---|
Imports C1.Win.C1Chart |
|
To write code in C#
| C# |
Copy Code
|
|---|---|
using C1.Win.C1Chart; |
|
To write code in Visual Basic
| Visual Basic |
Copy Code
|
|---|---|
C1Chart1.ToolTip.Enabled = True
Dim sc As ChartDataSeriesCollection = C1Chart1.ChartGroups(0).ChartData.SeriesList
For Each ds As ChartDataSeries In sc
    ds.TooltipText = "Series: {#TEXT}" + ControlChars.Cr + ControlChars.Lf + "x = {#XVAL}" + ControlChars.Cr + ControlChars.Lf + "y = {#YVAL}"
Next ds
|
|
To write code in C#
| C# |
Copy Code
|
|---|---|
ChartDataSeriesCollection sc =
c1Chart1.ChartGroups[0].ChartData.SeriesList;
  foreach (ChartDataSeries ds in sc)
     ds.TooltipText = "Series: {#TEXT}" + '\r' + '\n' + "x = {#XVAL}" + '\r' + '\n' + "y = {#YVAL}";
// Enable tooltip
c1Chart1.ToolTip.Enabled = true;
|
|
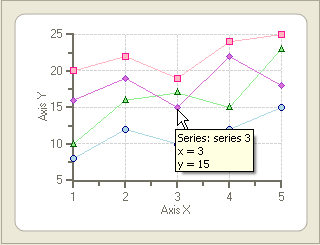
When you hover over the points in the data series on the chart area at run time, the tooltips appear for each point, like the following: