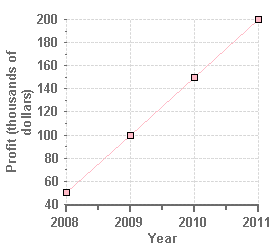
The Alignment property can be set to three different settings: Center, Near, or Far. Setting the alignment to center centers the axis title in comparison to the ChartArea. Setting the alignment to Near places the axis title to the left side of the ChartArea. Setting the alignment to Far places the axis title to the right side of the Chart Area.
The Font size and style for the axis title can be changed by manipulating the Font object of the axis. To access the font properties at design time click the ellipsis next to the Font node or expand the Font node under the axis object in the Visual Studio Properties window. To programmatically modify the Axis font properties, enter the following:
To write code in Visual Basic
| Visual Basic |
Copy Code
|
|---|---|
Dim f As Font = New Font("Arial", 8, FontStyle.Bold)
C1Chart1.ChartArea.AxisX.Font = f
|
|
To write code in C#
| C# |
Copy Code
|
|---|---|
Font  f = new Font("Arial", 8, FontStyle.Bold);
c1Chart1.ChartArea.AxisX.Font = f;
|
|
The ForeColor property changes the color of the axis line, tick marks, and title. To change the ForeColor set the ForeColor property to a valid color in code, or the property can also be accessed at design time under the Axis object in the Visual Studio Properties window.
The thickness of the axis is determined by the Thickness property. The value is specified in pixels. Axes with a zero thickness value are fully drawn except for the axis line itself.
The following chart displays the Y-Axis with its Thickness property set to zero:
