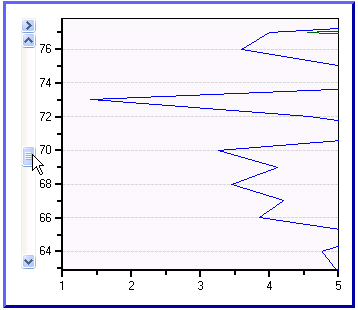
In circumstances when you have a substantial amount of X-values or Y-values in your chart data, you can add a scrollbar to the axes. Adding a scrollbar can make the data on the chart easier to read by scrolling through it so you can closely view pieces of data one at a time. The following image has the AxisScrollBar set to the AxisY object:
A scrollbar can appear on the X-Axis or Y-Axis simply by assigning the ScrollBar property to either the AxisX or AxisY object and then specifying the Min and Max values of the chart's data series. Setting the Min and Max values will prevent the scrollbar from changing the Axis values when you are scrolling.