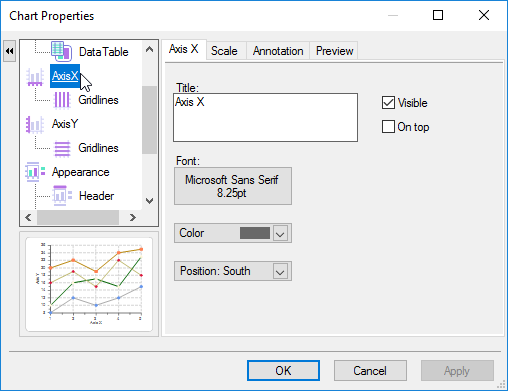
You can select Axis X, Axis Y, or Axis Y2 to modify or create the format style, scale, and annotation of the axes. Each axes element (AxisX, AxisY, and AxisY2) contain the following tabs in the upper right pane of the Chart dialog box: the name of the selected element (AxisX, AxisY, or AxisY2), the Scale, the Annotation, and the Preview tab.
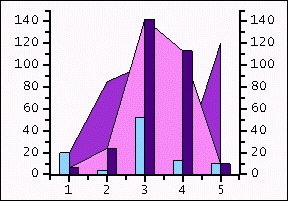
The Y2-axis element appears in the left pane of the Chart Properties designer once data is added to the second chart group (Group1). The data in the Y2-axis determines the maximum and minimum values of the axis in the same way that ChartGroup(0) data determines the maximum and minimum values of the Y-axis. Manual settings can be used to force alignment between axes. The picture below shows a chart that contains a Y2-axis.
In order to make the AxisY2 element appear in the left pane of the Chart Properties dialog box you must select a chart type for Data [Group1] in the Complex Types tab from the Gallery element. Also, after selecting a chart type for Data [Group1] you need to add a series to Data [Group1]. For more information see the Complex Types Tab.