You can use C1Chart's 3D effects with Bar charts or Stacking Bar charts to enhance the appearance of your charts. By using the depth, elevation, rotation, and shading properties, you can create the illusion of depth with each data series.
When the Depth property is used to modify the depth of the bar chart it does not affect the shape of the columns, however, it affects the shape of the cones, pyramids, and cylinders. The width of the of the cylinders automatically changes with the number of bars on the X axis, but the depth of the bar depends on the Depth property.
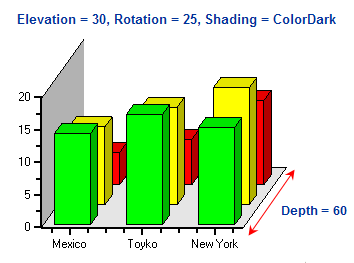
The following image represents such a chart that stands out from applying the 3D effects:
To access the 3D view for a bar chart, adjust the properties in the View3D object. The View3D object is a member of the PlotArea, which in turn is a member of the ChartArea. By adjusting the View3D object properties, Depth, Elevation, Rotation and Shading you can customize the 3D view.
Note that the Depth property is the key to all 3D type chart logic. While the Elevation and Rotation properties modify the way a user views the chart, it is the Depth property that actually dictates whether a chart is 3D. By using a non-zero value for the Depth property and setting the Elevation and Rotation property values to zero, you have created a 3D chart even though nothing seems to have changed. In effect you are looking at the front surface of the chart, which is visually represented in the same way as a standard area chart.
Note also, that there may be times when it is desirable to chart some data with a 3D view, and other data in the 2D plane. For these instances, adjust the Use3D property associated with each ChartGroup.