To bind data to C1Chart, first set the data source and then set the data field.
Step 1: Setting the DataSource
Once a valid data source has been created, set the C1Chart.DataSource property. This can be done at design time or run time.
To set the DataSource property at design time:
You can set the C1Chart.DataSource property at design time using any of the following methods:
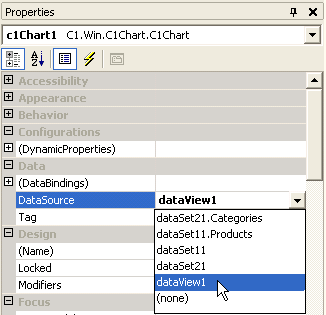
To set the C1Chart.DataSource property using C1Chart's Properties window:
1. Select C1Chart from the Properties drop-down list box
2. Then select a value from the C1Chart.DataSource property drop-down list box.
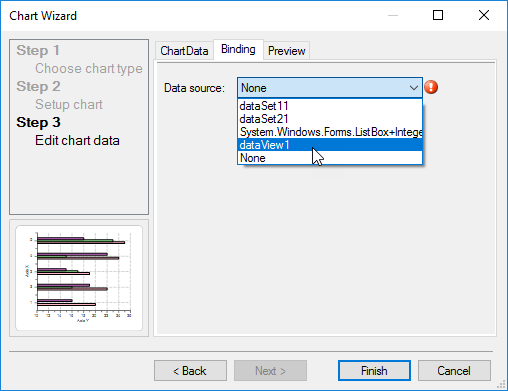
The C1Chart.DataSource property can also be set using the Chart Wizard or Chart Properties designer. To set the C1Chart.DataSource property using Chart Wizard, perform the following tasks:
1. In Step 3 of the Chart Wizard, select the Binding tab.
2. Select a value from the Data source drop-down list box.
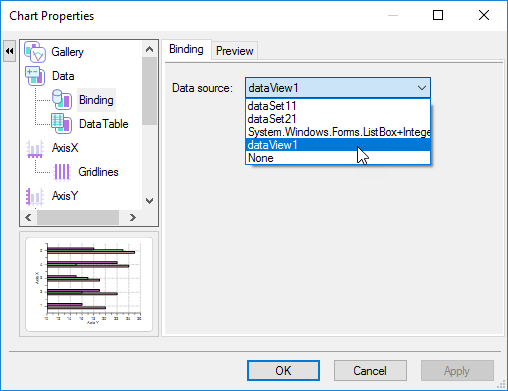
To set the DataSource property using Chart Properties designer, perform the following:
1. Right-click on the C1Chart control and select Chart Properties to access the Chart Properties editor.
2. Expand the Data element, then select Binding.
3. In the Binding tab, select a value from the Data source drop-down list box.
To set the chart DataSource property programmatically:
Use the following code to set the Char DataSource property to the data source object programmatically:
To write code in Visual Basic
| Visual Basic |
Copy Code
|
|---|---|
| C1Chart1.DataSource = DataSet11 | |
To write code in C#
| C# |
Copy Code
|
|---|---|
| c1Chart1.DataSource = dataSet11; | |
Step 2: Setting the data field
Once the C1Chart DataSource has been set, it is necessary to tell C1Chart which columns in the dataset should be applied to each of the ChartDataSeries. In other words, it is necessary to specify which column of the data source should be used to specify the X values, which column specifies the Y values, and depending upon the ChartType, the columns used for Y1, Y2 and Y3 of each ChartDataSeries.
The set of X values, Y values, and so on, are held by the ChartDataArray objects of each ChartDataSeries. These objects all have a DataField property which is used to specify the column of data in the data source that applies to the specific ChartDataArray. The DataField property may be set at either design time or run time.
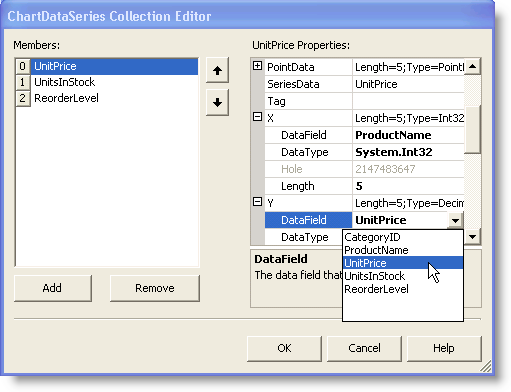
To set the data field using the designer
At design time, and using the Visual Studio .NET properties window, navigate through the ChartGroups, Group0, ChartData, and SeriesList, and open the SeriesList by double-clicking the ellipsis button. This opens the ChartDataSeries Collection Editor. Select the first series, and navigate the X property. The X property is a ChartDataArray object. Expand the X node. Select the DataField property, then select an available value from its drop-down list box.
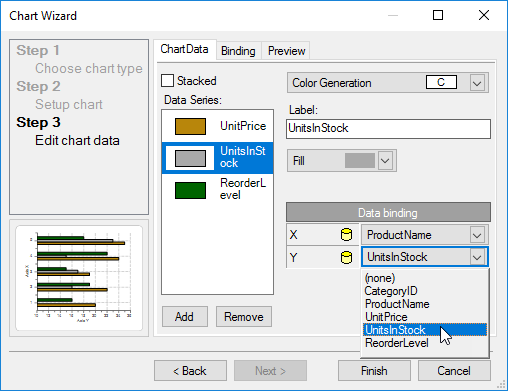
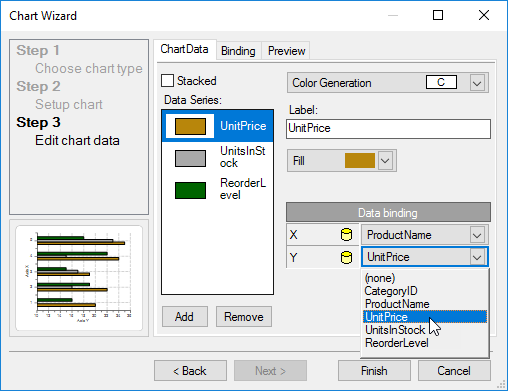
The DataField can be set from both the Chart Wizard and Chart Properties designers as well. The following image depicts the DataField in the X and Y drop-down list box of the Chart Wizard dialog box:
The following image depicts the DataField in the X and Y drop-down list box of the Chart Properties designer:
To set the data field using code
At run time, the DataField property is available on each ChartDataArray object of each ChartDataSeries. Note that the DataField property is set to a string value which indicates the name of the data source column.
To write code in Visual Basic
| Visual Basic |
Copy Code
|
|---|---|
| C1Chart1.ChartGroups(0).ChartData.SeriesList(0).X.DataField = "QuickStop.ShippedDate" C1Chart1.ChartGroups(0).ChartData.SeriesList(0).Y.DataField = "QuickStop.SaleAmount" |
|
To write code in C#
| C# |
Copy Code
|
|---|---|
| c1Chart1.ChartGroups[0].ChartData.SeriesList[0].X.DataField = "QuickStop.ShippedDate"; c1Chart1.ChartGroups[0].ChartData.SeriesList[0].Y.DataField = "QuickStop.SaleAmount"; |
|
Please note the syntax of the string. In code sample above, QuickStop is the TableName containing the column, and ShippedDate and SaleAmount are the column names. Whether or not the TableName appears in the string depends upon the data source itself. In the above case, a DataSet object with multiple tables is used as a data source, so the TableName is required. If a specific table in the DataSet object were used as the data source, then only the column names would be used.