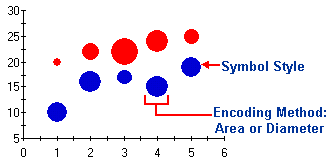
A Bubble chart combines two independent values to supply both the point y value and the point sizes. Bubble charts are used to represent an additional data value at each point by changing its size. The Y array elements determine the Cartesian position (as in a XY-Plot chart), and the Y1 element values determine the size of the bubble at each point. The size of the points can be encoded according to area or diameter. Using the LineStyle and SymbolStyle properties, the symbol style and color, and the appearance of connecting lines appear can be specified. For more information, see Line and Symbol Styles for the Series.