This section provides step-by-step instructions for building a report that displays the products' unit price, units in stock, and reorder level organized by categories. The report shows the information as a simple bar chart with one y-axis that represents the names of the products and one x-axis the represents the numerical values for the products' unit price, units in stock, and reorder level. The Bar chart uses three series to draw the unit price, units in stock, and reorder level. A legend is used to show the color for each series.
The chart uses data from the sample Access database, C1NWind.mdb. This quick start assumes that the database file C1NWind.mdb is in the "<PersonalDocumentsFolder>\ComponentOne Samples\Common" where <PersonalDocumentsFolder> is the users Documents folder which varies from user to user and platform to platform.
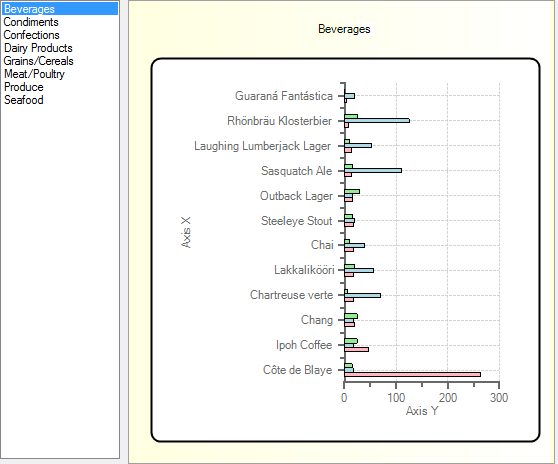
Completing this quick start will produce a chart that resembles the following illustration: